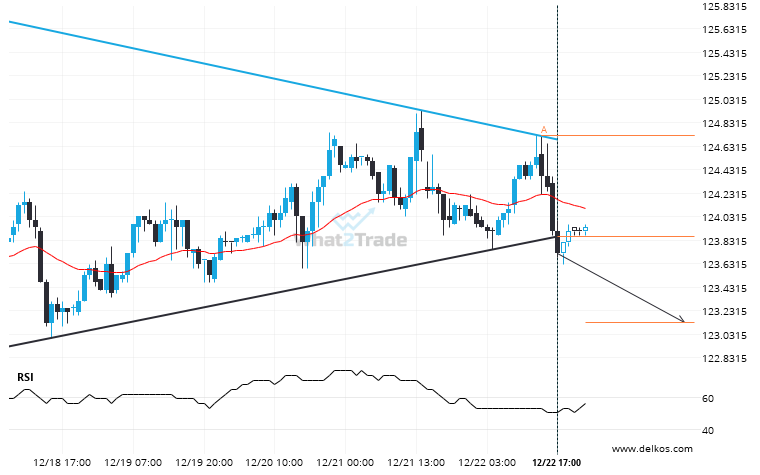
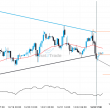
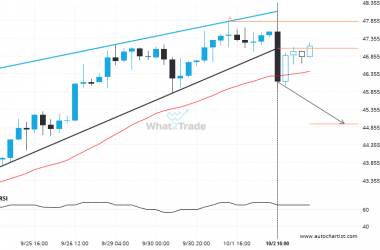
Us Treasury Bond March 2024 moved through the support line of a Triangle at 123.86111111111111 on the 1 hour chart. This line has been tested a number of times in the past and this breakout could mean an upcoming change from the current trend. It may continue in its current direction toward 123.1359.
Related Posts
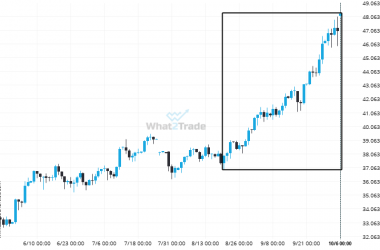
A very large move was recorded on Silver Spot. The size of the shift is exceptional.
Silver Spot just posted a 27.23% move over the past 48 days – a move that won’t go…
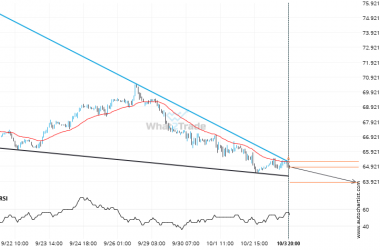
Brent Crude formed a Falling Wedge on the 1 hour chart. Retest of support in sight.
Emerging Falling Wedge detected on Brent Crude – the pattern is an emerging one and has not yet…
Breach of support could mean a start of a bearish trend on Silver Spot
This trade setup on Silver Spot is formed by a period of consolidation; a period in which the…

