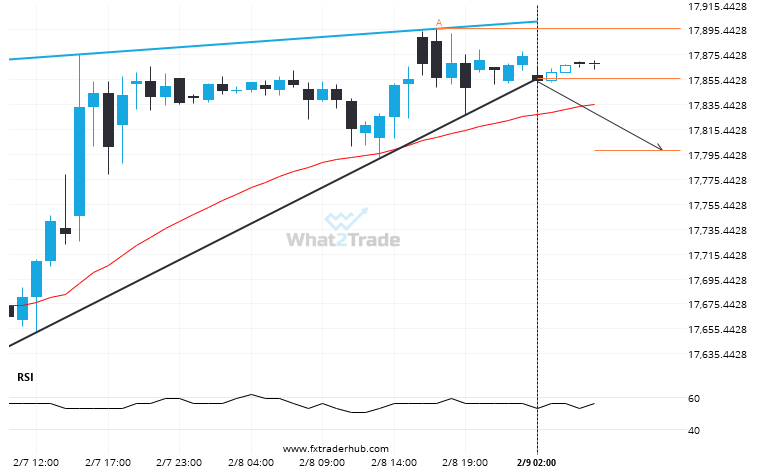
NAS100 moved through the support line of a Rising Wedge at 17856.1875 on the 1 hour chart. This line has been tested a number of times in the past and this breakout could mean an upcoming change from the current trend. It may continue in its current direction toward 17798.3787.
Related Posts
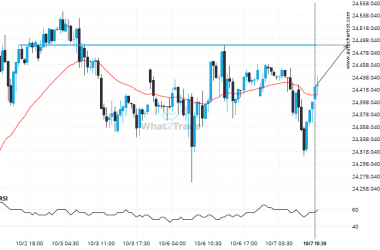
After testing 24489.3008 numerous times, DAX 40 is once again approaching this price point. Can we expect a bullish trend to follow?
The movement of DAX 40 towards 24489.3008 price line is yet another test of the line it reached…
NAS 100 – approaching a resistance line that has been previously tested at least twice in the past
The movement of NAS 100 towards the resistance line of a Rising Wedge is yet another test of…
Nikkei 225 reached 47590.0 after a 3.64% move spanning 3 days.
Nikkei 225 reached 47590.0 after a 3.64% move spanning 3 days.

