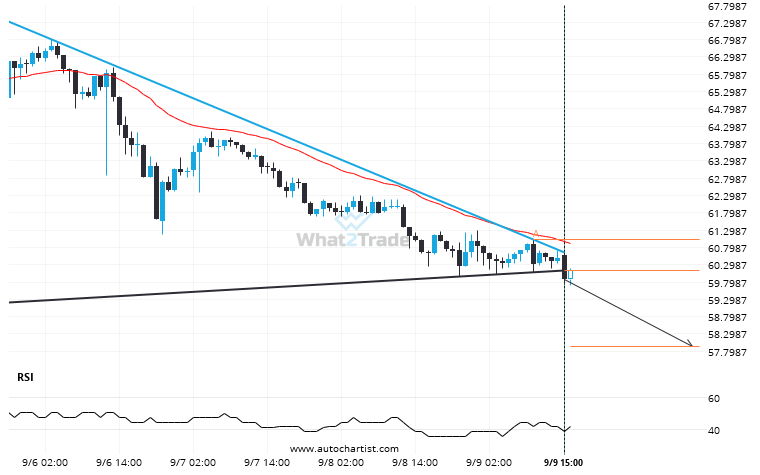
LTCUSD has broken through a support line of a Triangle chart pattern. If this breakout holds true, we may see the price of LTCUSD testing 57.9294 within the next 2 days. But don’t be so quick to trade, it has tested this line in the past, so you should confirm the breakout before taking any action.
Related Posts
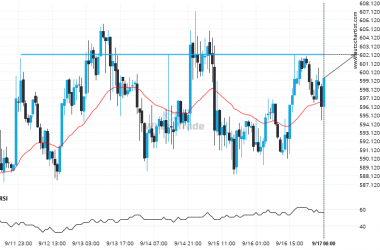
After testing 602.1300 numerous times, BCHUSD is once again approaching this price point. Can we expect a bullish trend to follow?
BCHUSD is moving towards a resistance line. Because we have seen it retrace from this level in the…
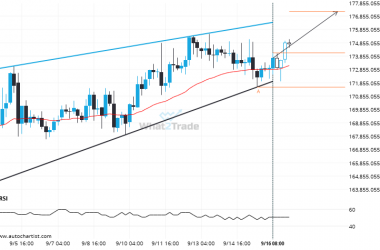
BTCAUD is approaching a resistance line of a Rising Wedge. It has touched this line numerous times in the last 15 days.
BTCAUD is moving towards a resistance line. Because we have seen it retrace from this line before, we…
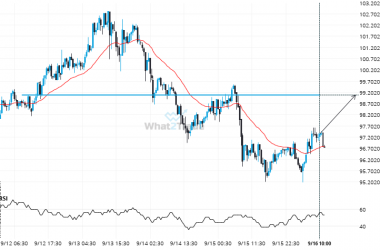
Supports and resistances are primary concepts of technical analysis. LTCEUR is heading for an important price of 99.0900 – read about what this could mean for the future.
The movement of LTCEUR towards 99.0900 price line is yet another test of the line it reached numerous…

