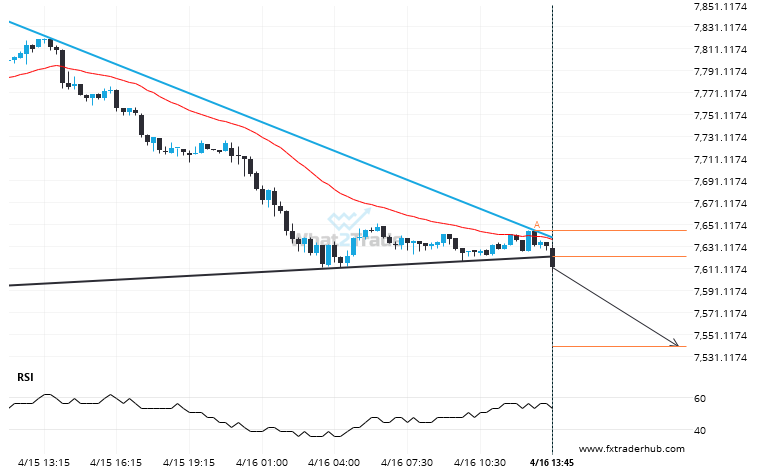
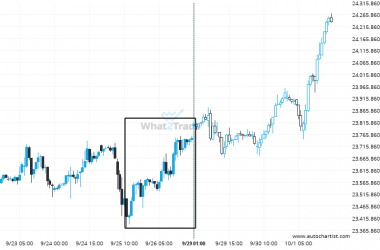
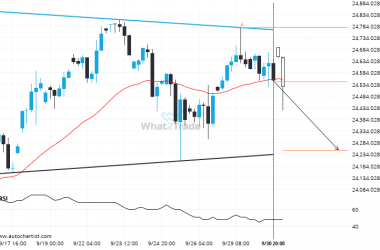
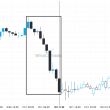
AUS200 moved through the support line of a Triangle at 7622.5 on the 15 Minutes chart. This line has been tested a number of times in the past and this breakout could mean an upcoming change from the current trend. It may continue in its current direction toward 7540.2150.
Related Posts
FTSE 100 experienced a very large 59 days bullish move to 8786.0
A movement of 14.45% over 59 days on FTSE 100 doesn’t go unnoticed. You may start considering where…
Nikkei 225 through 37689.35294117647. Is this a confirming a breakout? Will it continue its path in the current trend toward 38106.6602?
Nikkei 225 has broken through a resistance line of a Triangle chart pattern. If this breakout holds true,…
Supports and resistances are primary concepts of technical analysis. Nikkei 225 is heading for an important price of 37699.0000 – read about what this could mean for the future.
Nikkei 225 is moving towards a key resistance level at 37699.0000. This is a previously tested level for…