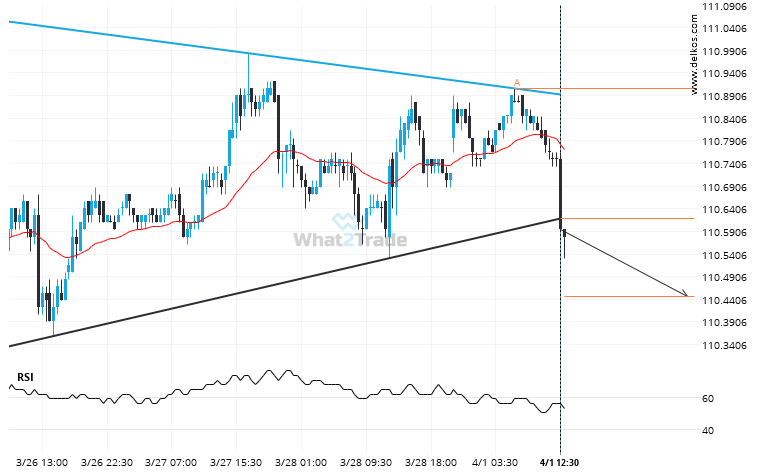
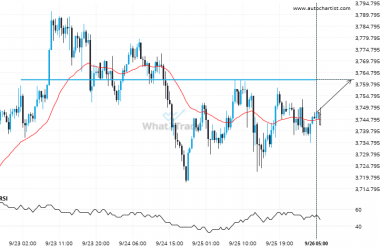
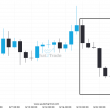
10 Yr Us Treasury Note June 2024 moved through the support line of a Triangle at 110.619140625 on the 30 Minutes chart. This line has been tested a number of times in the past and this breakout could mean an upcoming change from the current trend. It may continue in its current direction toward 110.4460.
Related Posts
Brent Crude is signaling a possible trend reversal on the intraday charts with price not breaching support.
Brent Crude is heading towards the resistance line of a Channel Up and could reach this point within…
An unexpected large move has occurred on Natural Gas Daily chart! Is this a sign of something new? What can we expect?
Natural Gas hits 3.033 after a 25.87% move spanning 23 days.
Important price line being approached by Silver Spot. This price has been tested numerous times before.
Silver Spot is heading towards a line of 32.9415. If this movement continues, the price of Silver Spot…