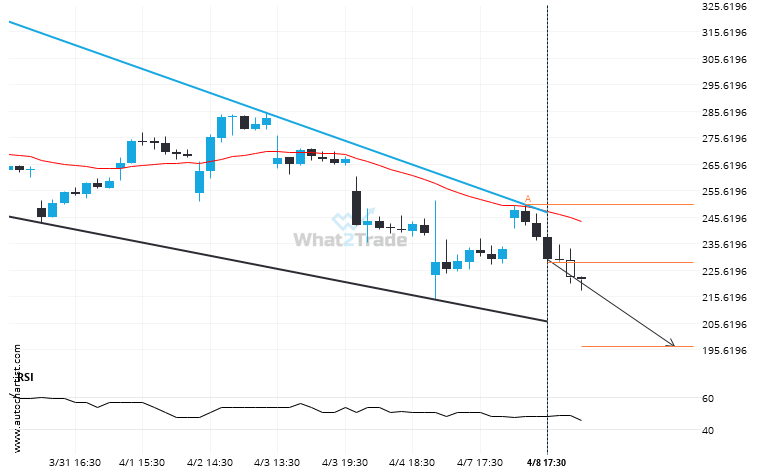
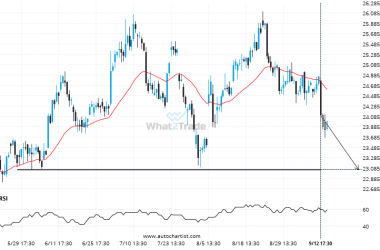
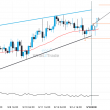
An emerging Falling Wedge has been detected on TSLA on the 1 hour chart. There is a possible move towards 196.6882 next few candles. Once reaching resistance it may continue its bearish run or reverse back to current price levels.
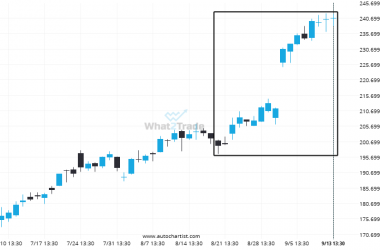
Related Posts
Important price line being approached by GOOGL. This price has been tested numerous times before.
A strong resistance level has been identified at 161.7200 on the 15 Minutes GOOGL chart. GOOGL is likely…
BRK.B is signaling a possible trend reversal on the intraday charts with price not breaching support.
BRK.B is heading towards the resistance line of a Channel Up. If this movement continues, the price of…
After trying numerous times in the past, NVDA finally breaks 115.3900!
NVDA is once again retesting a key horizontal resistance level at 115.3900. It has tested this level 3…