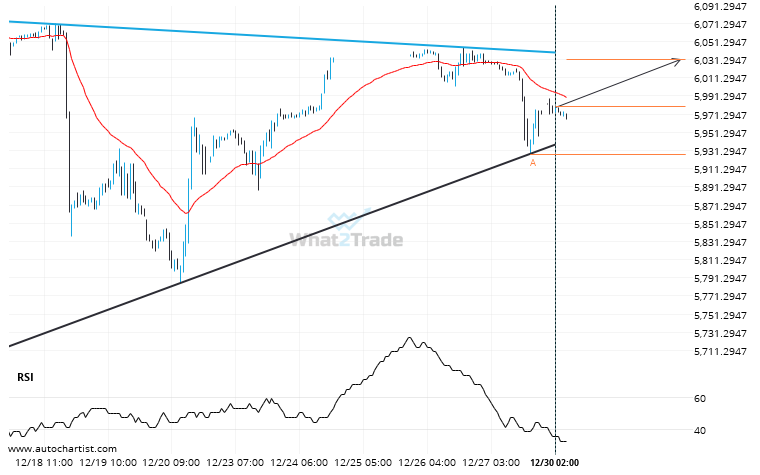
An emerging Triangle has been detected on US 500 on the 1 hour chart. There is a possible move towards 6030.9761 next few candles. Once reaching support it may continue its bullish run or reverse back to current price levels.
Related Posts
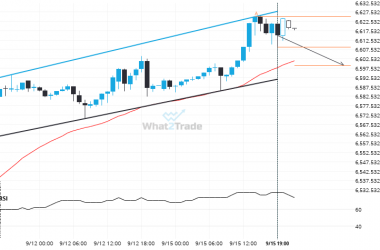
US 500 formed a Channel Up on the 1 hour chart. Retest of support in sight.
US 500 is trapped in a Channel Up formation, implying that a breakout is Imminent. This is a…
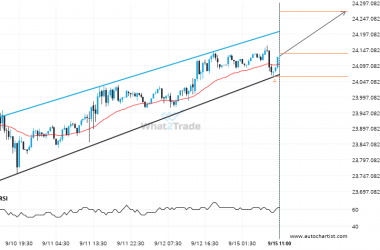
Because NAS 100 formed a Channel Up pattern, we expect it to touch the resistance line. If it breaks through resistance it may move much higher
NAS 100 is approaching the resistance line of a Channel Up. It has touched this line numerous times…
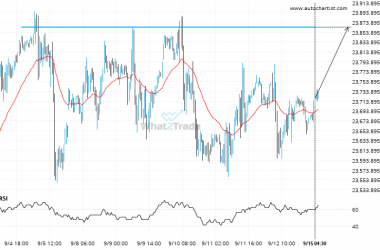
DAX 40 keeps moving closer towards 23863.9004. Will it finally breach this level?
DAX 40 is about to retest a key horizontal resistance level near 23863.9004. It has tested this level…

