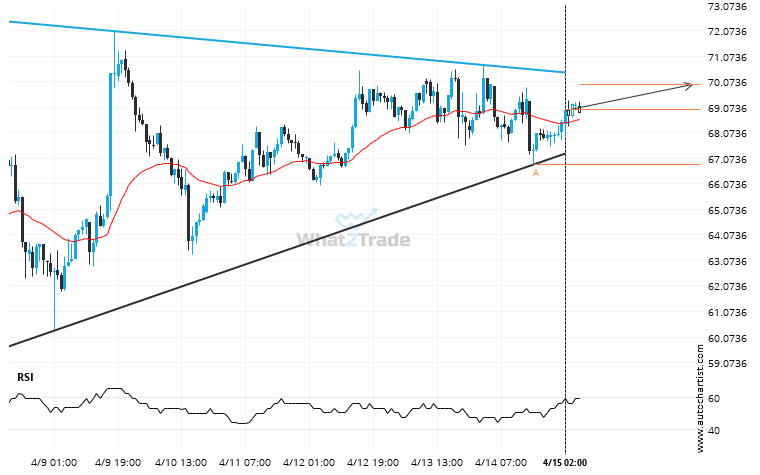
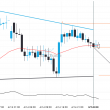
LTCEUR was identified at around 68.99 having recently rebounded of the support on the 1 hour data interval. Ultimately, the price action of the stock has formed a Triangle pattern. This squeeze may increases the chances of a strong breakout. The projected movement will potentially take the price to around the 69.9498 level.
Related Posts
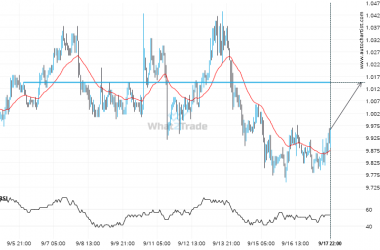
LTCBTC – approaching a price line that has been previously tested numerous times in the past
LTCBTC is heading towards a line of 1.0150E-03. If this movement continues, the price of LTCBTC could test…
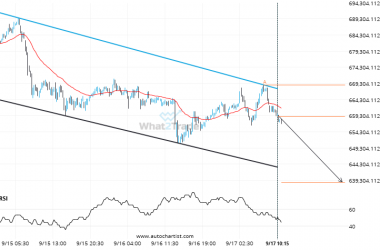
A possible move on ETHJPY as it heads towards support
An emerging Channel Down has been detected on ETHJPY on the 15 Minutes chart. There is a possible…
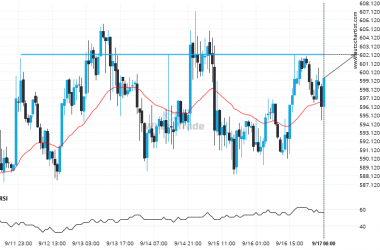
After testing 602.1300 numerous times, BCHUSD is once again approaching this price point. Can we expect a bullish trend to follow?
BCHUSD is moving towards a resistance line. Because we have seen it retrace from this level in the…

