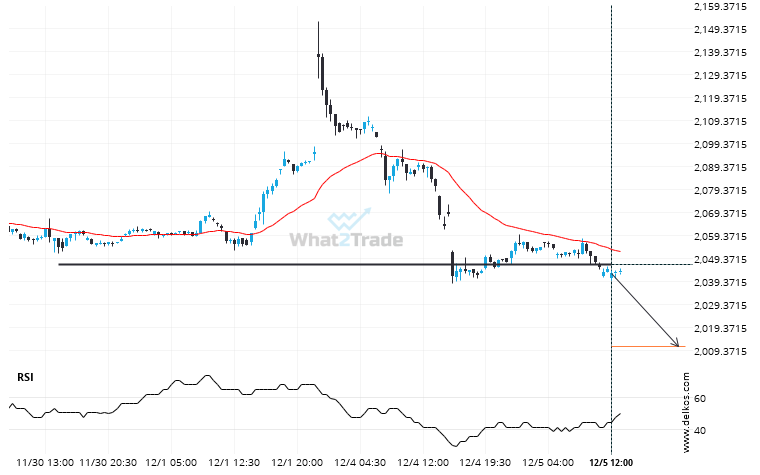
A strong support level has been breached at 2046.5000 on the 30 Minutes Gold February 2024 chart. Technical Analysis theory forecasts a movement to 2010.8700 in the next 16 hours.
Related Posts
If you’re long Natural Gas you should be aware of the rapidly approaching level of 3.4305
A strong support level has been identified at 3.4305 on the 15 Minutes Natural Gas chart. Natural Gas…
US Oil is signaling a possible trend reversal on the intraday charts with price not breaching resistance.
A Channel Up pattern was identified on US Oil at 61.7135, creating an expectation that it may move…
Gold Spot through 3225.946052631579. Is this a confirming a breakout? Will it continue its path in the current trend toward 3282.6858?
Gold Spot has broken through the resistance line which it has tested twice in the past. We have…