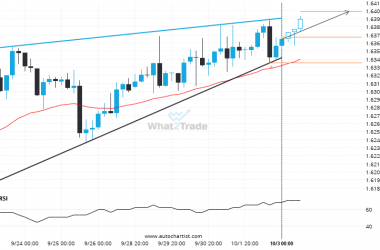
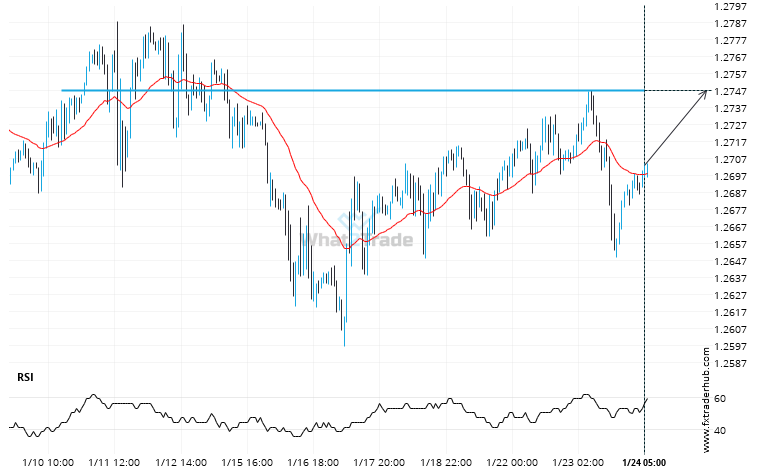
GBP/USD is approaching a resistance line at 1.2747. If it hits the resistance line, it may break through this level to continue the bullish trend, or it may turn around back to current levels.
If GBP/USD touches 1.2747 it may be time to take action.

GBP/USD is approaching a resistance line at 1.2747. If it hits the resistance line, it may break through this level to continue the bullish trend, or it may turn around back to current levels.