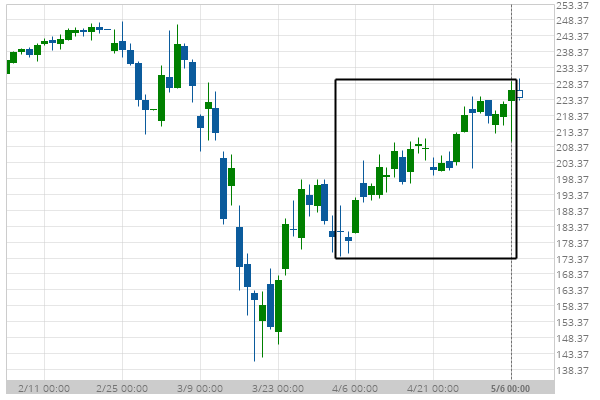
A movement of 24.72% over 35 days on Home Depot Inc. doesn’t go unnoticed. You may start considering where it’s heading next, a continuation of the current upward trend, or a reversal in the previous direction.
Related Posts
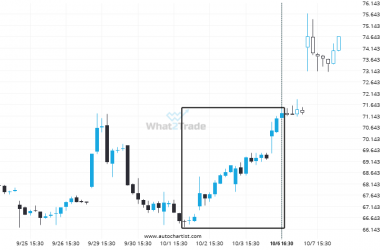
Big bullish swing on PYPL – this may be one of its more notable movements in the recent session.
PYPL reached 71.24 after a 7.18% move spanning 5 days.
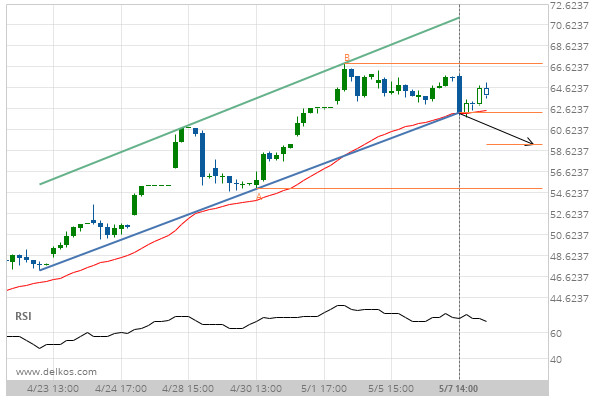
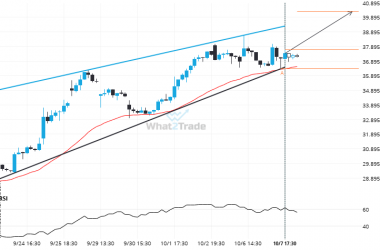
INTC formed a Rising Wedge on the 1 hour chart. Retest of resistance in sight.
Emerging Rising Wedge pattern in its final wave was identified on the INTC 1 hour chart. After a…
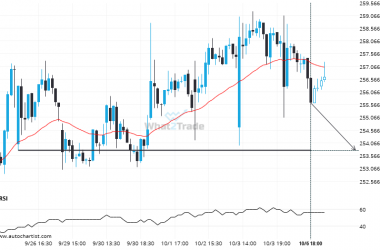
AAPL likely to test 253.7800 in the near future. Where to next?
AAPL is approaching a support line at 253.7800. If it hits the support line, it may break through…


