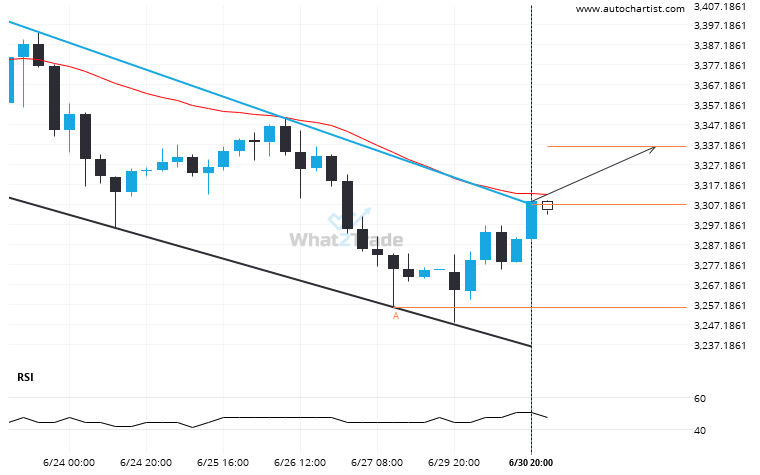
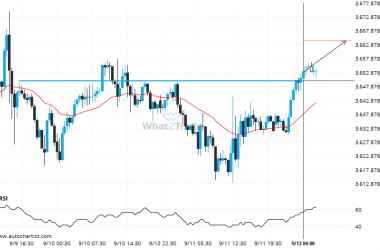
This trade setup on Gold Spot is formed by a period of consolidation; a period in which the price primarily moves sideways before choosing a new direction for the longer term. Because of the bullish breakout through resistance, it seems to suggest that we could see the next price move to 3336.0673.
Gold Spot broke through a resistance at 2025-06-30T18:00:00.000Z, with the price momentum continuing to move in an upward direction over the next hours, good opportunity presents itself with the price expected to reach 3336.0673.