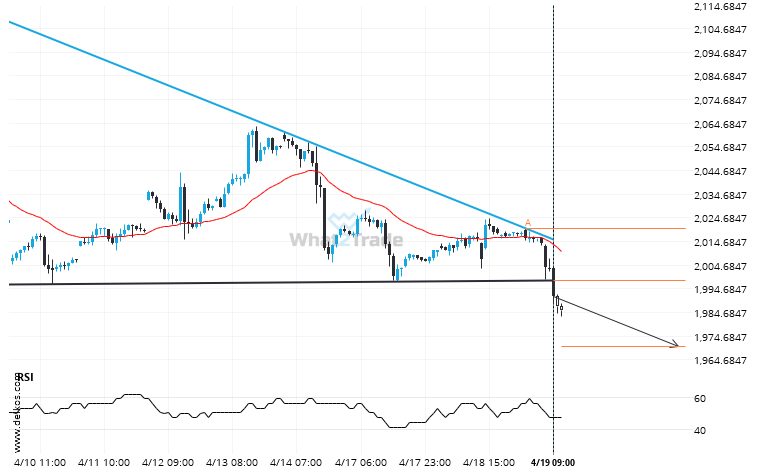
Gold JUNE 2023 has broken through a support line. It has touched this line at least twice in the last 14 days. This breakout may indicate a potential move to 1970.2105 within the next 2 days. Because we have seen it retrace from this position in the past, one should wait for confirmation of the breakout before trading.
Related Posts
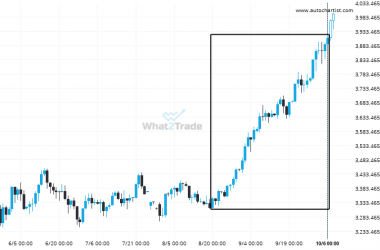
Gold Spot experienced a very large 48 days bullish move to 3909.648.
Gold Spot reached 3909.648 after a 16.81% move spanning 48 days.
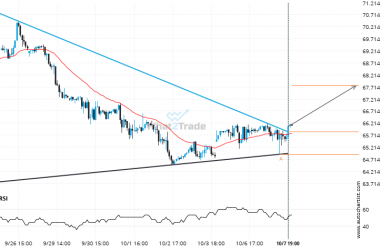
Brent Crude through 65.85670422535212. Is this a confirming a breakout? Will it continue its path in the current trend toward 67.7624?
Triangle pattern identified on Brent Crude has broken through a resistance level with the price momentum continuing to…
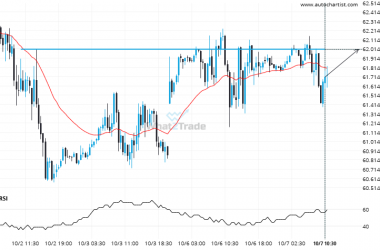
Will US Oil break through the resistance level it tested before?
US Oil is moving towards a key resistance level at 62.0110. This is a previously tested level for…


