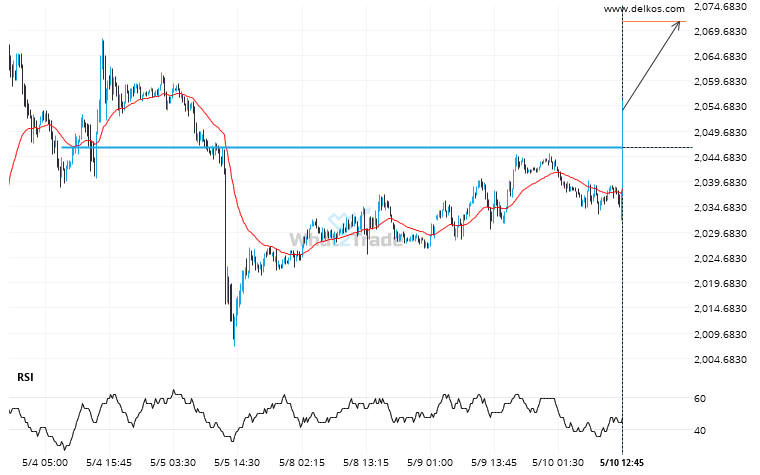
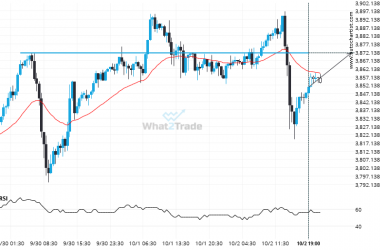
Gold JUNE 2023 has broken through a resistance line. It has touched this line numerous times in the last 7 days. This breakout shows a potential move to 2071.4600 within the next 2 days. Because we have seen it retrace from this level in the past, one should wait for confirmation of the breakout.
Gold JUNE 2023 has broken through a resistance line. It has touched this line numerous times in the last 7 days.