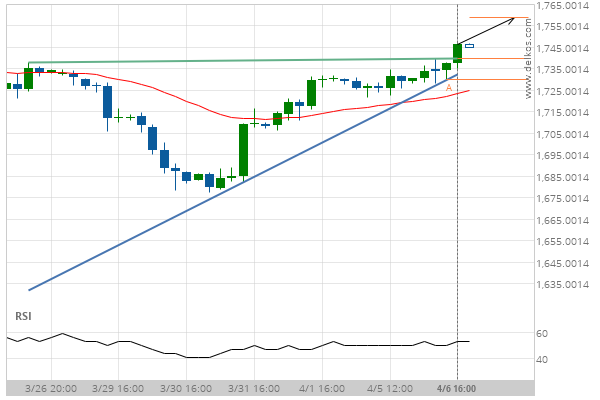
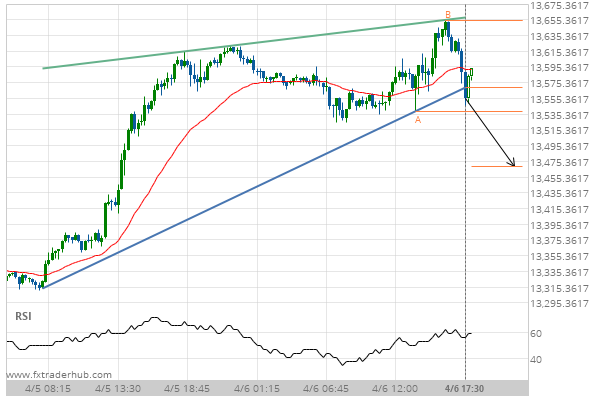
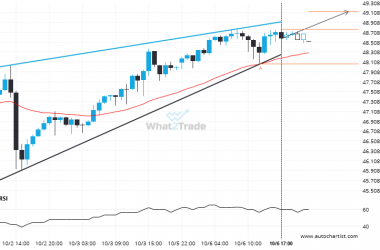
Gold JUNE 2021 has broken through the resistance line of a Ascending Triangle technical chart pattern. Because we have seen it retrace from this position in the past, one should wait for confirmation of the breakout before trading. It has touched this line twice in the last 12 days and suggests a target line to be around 1758.6659 within the next 2 days.
Related Posts
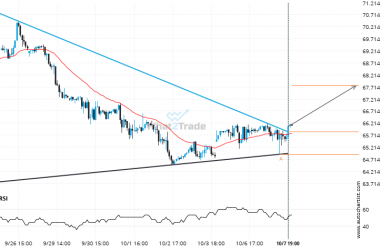
Brent Crude through 65.85670422535212. Is this a confirming a breakout? Will it continue its path in the current trend toward 67.7624?
Triangle pattern identified on Brent Crude has broken through a resistance level with the price momentum continuing to…
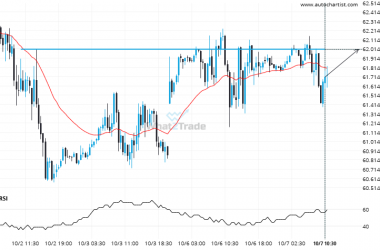
Will US Oil break through the resistance level it tested before?
US Oil is moving towards a key resistance level at 62.0110. This is a previously tested level for…
Silver Spot is signaling a possible trend reversal on the intraday charts with price not breaching support.
Silver Spot was identified at around 48.76785 having recently rebounded of the support on the 1 hour data…

