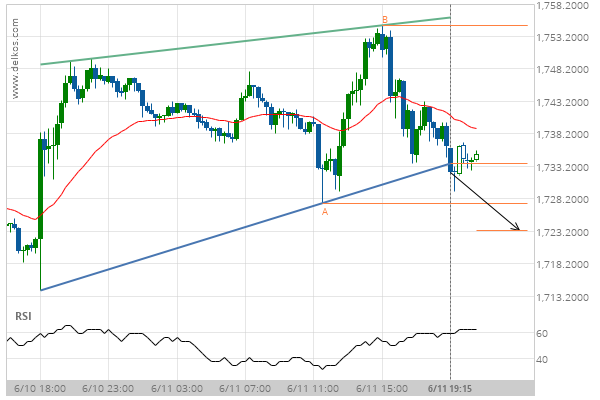
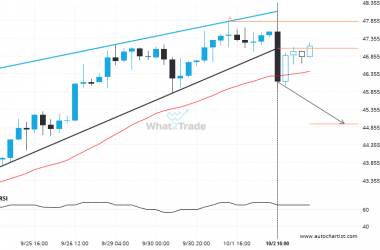
Gold AUGUST 2020 has broken through the support line of a Rising Wedge technical chart pattern. Because we have seen it retrace from this position in the past, one should wait for confirmation of the breakout before trading. It has touched this line twice in the last 2 days and suggests a target line to be around 1723.3332 within the next 6 hours.
Related Posts
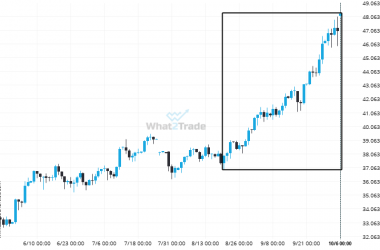
A very large move was recorded on Silver Spot. The size of the shift is exceptional.
Silver Spot just posted a 27.23% move over the past 48 days – a move that won’t go…
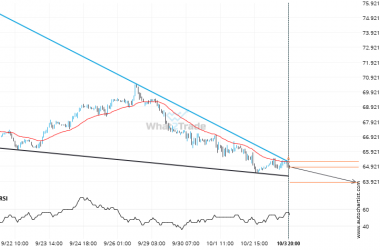
Brent Crude formed a Falling Wedge on the 1 hour chart. Retest of support in sight.
Emerging Falling Wedge detected on Brent Crude – the pattern is an emerging one and has not yet…
Breach of support could mean a start of a bearish trend on Silver Spot
This trade setup on Silver Spot is formed by a period of consolidation; a period in which the…

