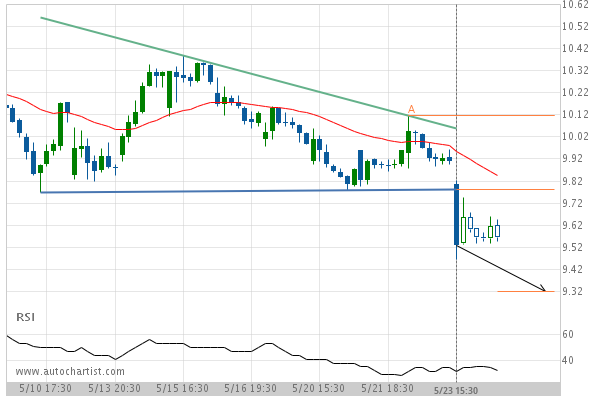
General Electric Co. has broken through the support line of a Descending Triangle technical chart pattern. Because we have seen it retrace from this position in the past, one should wait for confirmation of the breakout before trading. It has touched this line twice in the last 13 days and suggests a target line to be around 9.33 within the next 14 hours.
Related Posts
BABA recorded 6 consecutive 4 hour bullish candles.
BABA posted 6 consecutive candles over the last 5 day — an unusually large movement.
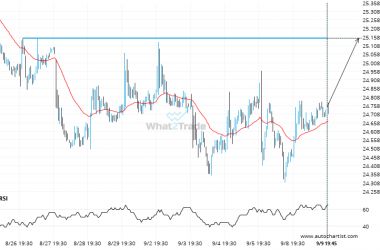
A final push possible on PFE as it starts approaching a price line of 25.1500.
PFE is moving towards a key resistance level at 25.1500. This is a previously tested level for PFE.…
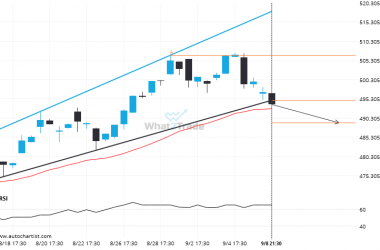
BRK.B breakout from a Channel Up trade setup. Will it continue this trend to hit the target price?
BRK.B has broken through the support line of a Channel Up technical chart pattern. Because we have seen…


