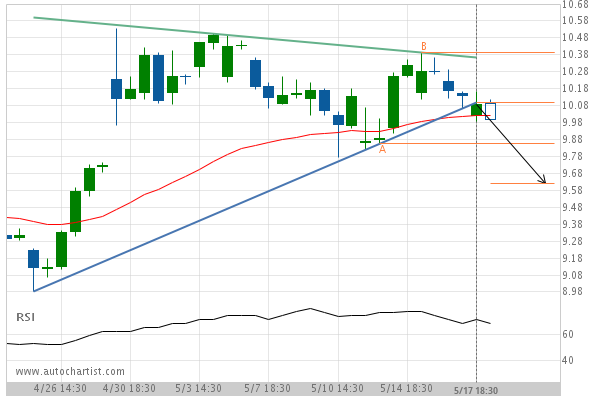
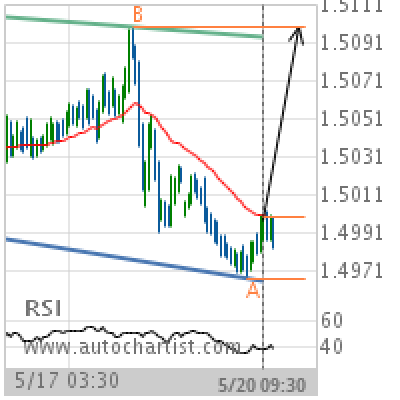
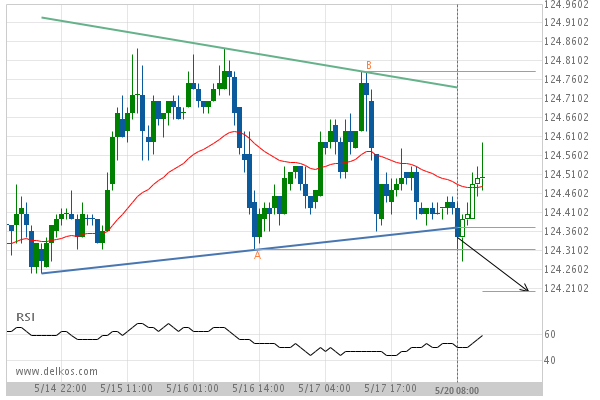
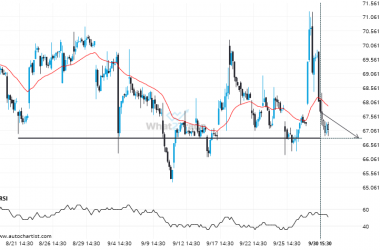
General Electric Co. has broken through the support line of a Triangle technical chart pattern. Because we have seen it retrace from this position in the past, one should wait for confirmation of the breakout before trading. It has touched this line twice in the last 23 days and suggests a target line to be around 9.62 within the next 2 days.
Related Posts
After testing 743.9550 numerous times, META has finally broken through. Can we expect a bearish trend to follow?
META has breached the support line at 743.9550. It may continue the bearish trend towards 708.9245, or, it…
Interesting opportunity on PFE after breaking 24.416999999999994
This trade setup on PFE is formed by a period of consolidation; a period in which the price…
PYPL keeps moving closer towards 66.7950. Will it finally breach this level?
The price of PYPL in heading back to the support area. It is possible that it will struggle…

