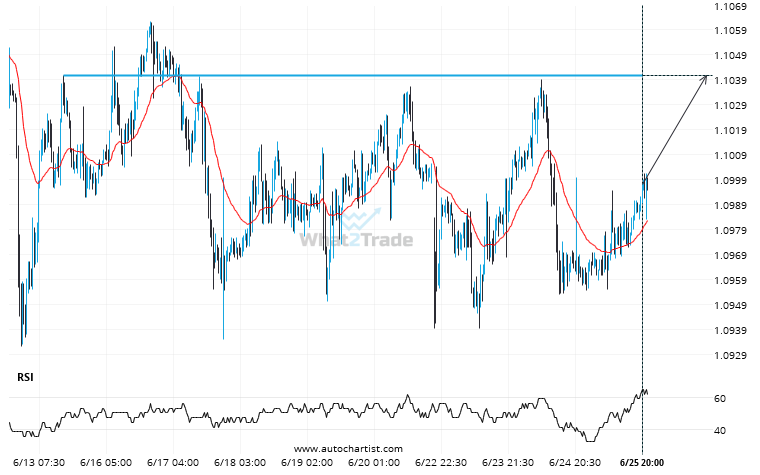
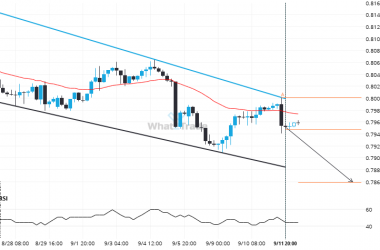
GBPCHF is moving towards a line of 1.1041 which it has tested numerous times in the past. We have seen it retrace from this position in the past, so at this stage it isn’t clear whether it will breach this price or rebound as it did before. If GBPCHF continues in its current trajectory, we may see it move towards 1.1041 within the next 2 days.
Related Posts
NZDUSD is signaling a possible trend reversal on the intraday charts with price not breaching resistance.
NZDUSD is approaching the support line of a Channel Up. It has touched this line numerous times in…
After testing the support line numerous times, EURJPY is once again approaching this line. Can we expect a bearish trend to follow?
EURJPY was identified at around 172.4435 having recently rebounded of the resistance on the 30 Minutes data interval.…
Rare set of bullish consecutive candles on the GBPJPY Daily chart. Can we expect a turn-around?
After posting 7 consecutive bullish candles in 8 days, you may start considering where GBPJPY is heading next,…