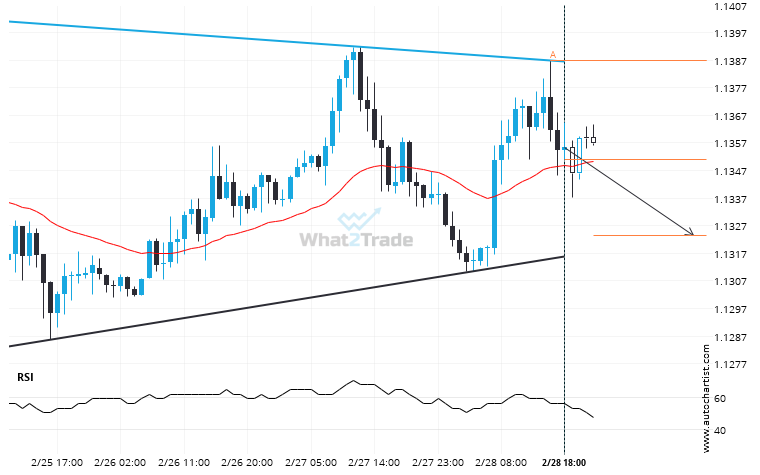
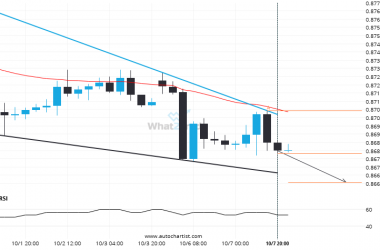
Emerging Triangle pattern in its final wave was identified on the GBPCHF 1 hour chart. After a strong bearish run, we find GBPCHF heading towards the upper triangle line with a possible resistance at 1.1323. If the support shows to hold, the Triangle pattern suggests a rebound back towards current levels.
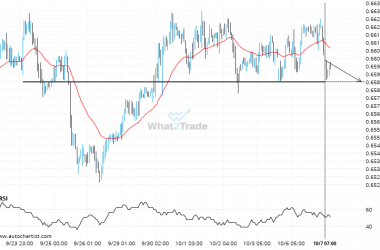
Related Posts
Because EURCAD formed a Channel Up pattern, we expect it to touch the resistance line. If it breaks through resistance it may move much higher
EURCAD is approaching the resistance line of a Channel Up. It has touched this line numerous times in…
GBPCHF seems to be on its way to support – a possible opportunity?
GBPCHF is moving towards a key support level at 1.0950. GBPCHF has previously tested this level 3 times…
USDCHF has formed 5 bearish candles successively, what is the probability of getting another bearish candle?
Due to the rate of consecutive bearish candles on USDCHF Daily chart we could be in for a…