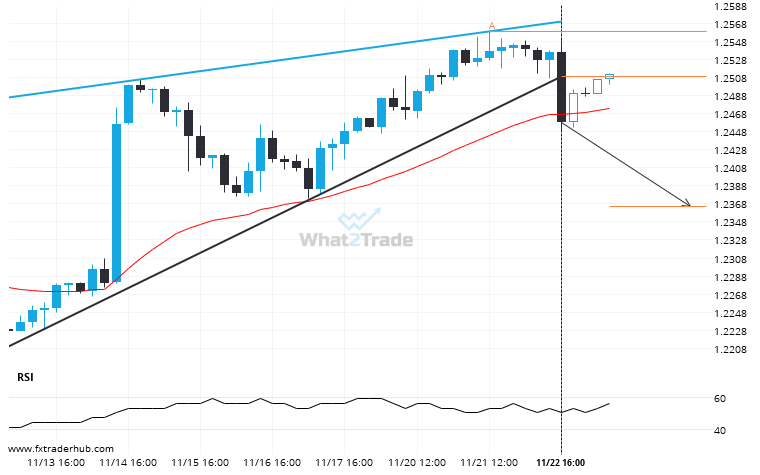
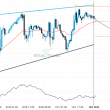
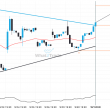
The last 17 4 hour candles on GBP/USD formed a Rising Wedge pattern and broken out through the pattern lines, indicating a possible bearish movement towards the price level of 1.2365.
Related Posts
Could a large bullish move on EURUSD be a sign of things to come?
A movement of 5.54% over 21 days on EURUSD doesn’t go unnoticed. You may start considering where it’s…
NZDUSD has formed 5 bullish candles successively, what is the probability of getting another bullish candle?
After posting 5 consecutive bullish candles in 6 days, you may start considering where NZDUSD is heading next,…
CHFJPY is quickly approaching the support line of a Descending Triangle. We expect either a breakout through this line or a rebound.
Emerging Descending Triangle pattern in its final wave was identified on the CHFJPY 1 hour chart. After a…