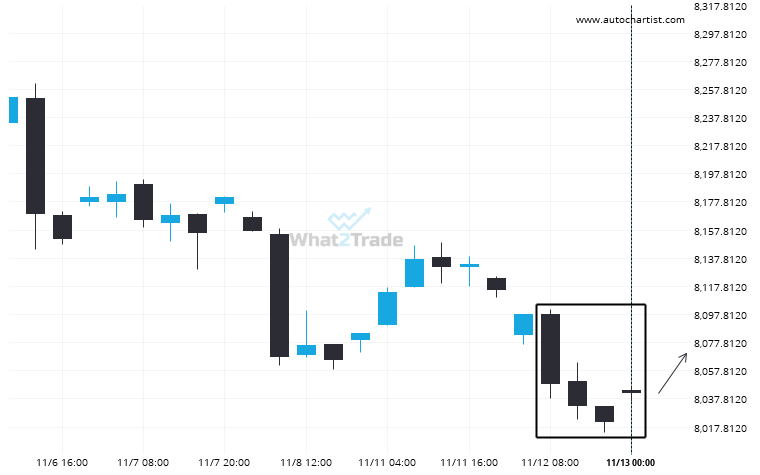
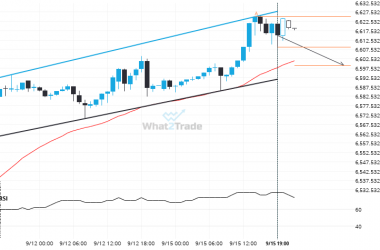
Due to the rate of consecutive bearish candles on FTSE 100 4 hour chart we could be in for a price correction. If not, this trend could be a sign of things to come
Related Posts
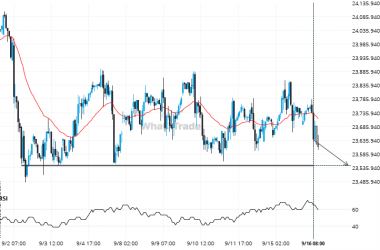
DAX 40 keeps moving closer towards 23544.0000. Will it finally breach this level?
DAX 40 is moving towards a line of 23544.0000 which it has tested numerous times in the past.…
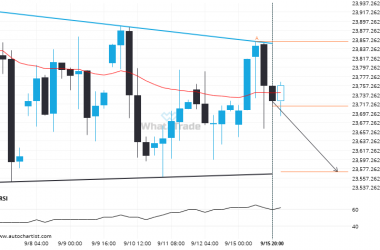
A Descending Triangle has formed, DAX 40 is approaching resistance. Can we expect a breakout and the start of a new trend or a reversal?
DAX 40 is moving towards a support line which it has tested numerous times in the past. We…
US 500 formed a Channel Up on the 1 hour chart. Retest of support in sight.
US 500 is trapped in a Channel Up formation, implying that a breakout is Imminent. This is a…

