Receive the latest alerts via email

Extreme movement experienced on US30. Check this chart to see what to do next

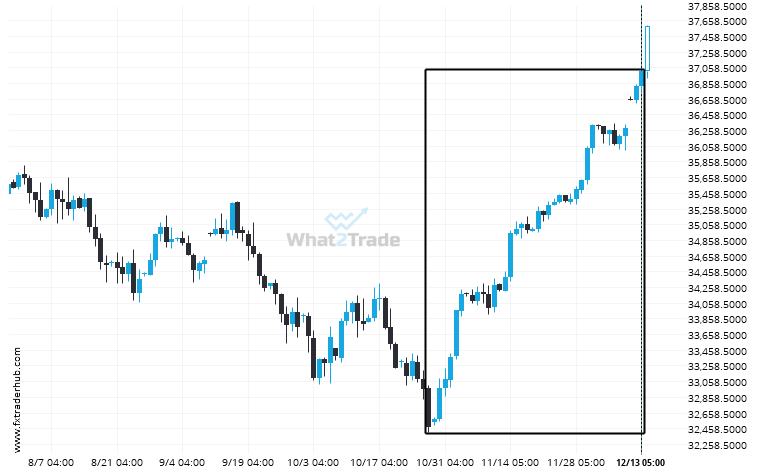
US30 has moved higher by 13.95% from 32475.0 to 37005.0 in the last 48 days.

Total
0
Shares
Previous Post

Movimiento extremo experimentado en US30. Consulte este gráfico para ver qué hacer a continuación

Next Post

An unexpected large move has occurred on Us Treasury Bond March 2024 1 hour chart! Is this a sign of something new? What can we expect?

Related Posts