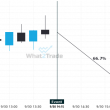
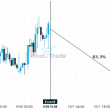
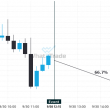
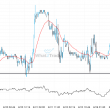
ADAUSD dropped sharply for 10 days – which is an excessively big movement for this instrument; exceeding the 98% of past price moves. Even if this move is a sign of a new trend in ADAUSD there is a chance that we will witness a correction, no matter how brief.
Related Posts
After testing the support line numerous times, XRPUSD is once again approaching this line. Can we expect a bearish trend to follow?
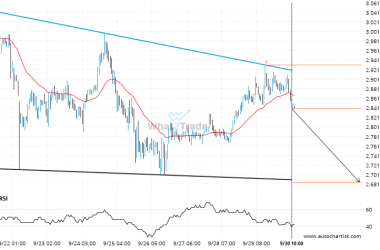
Emerging Descending Triangle pattern in its final wave was identified on the XRPUSD 1 hour chart. After a…
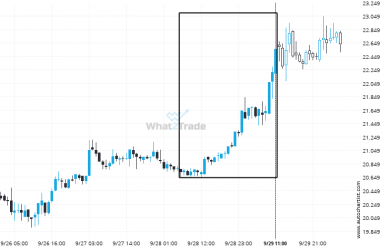
DASHUSD experienced a 8.88% bullish move in just 2 days. The magnitude speaks for itself.
DASHUSD reached 22.56 after a 8.88% move spanning 2 days.
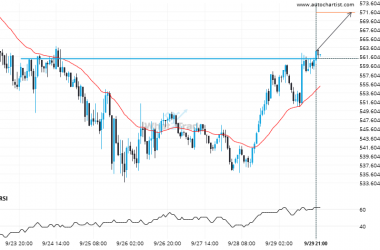
It’s time to make a decision on BCHUSD – its recent breach of 561.1700 could be a sign of a new trend to follow.
BCHUSD has broken through a line of 561.1700 and suggests a possible movement to 571.4180 within the next…

