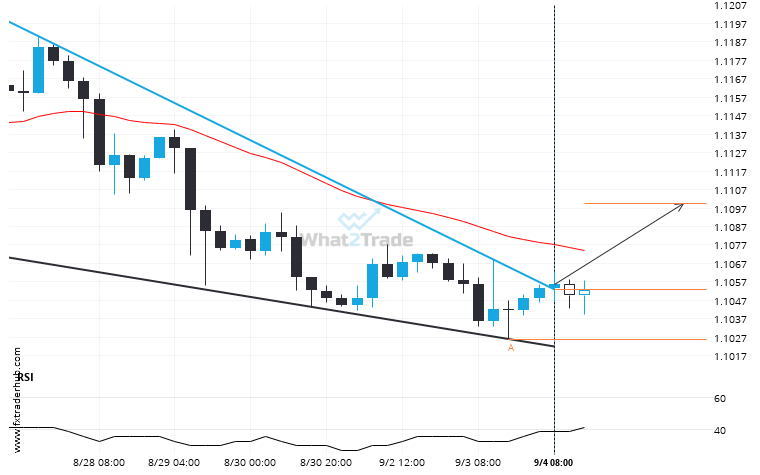
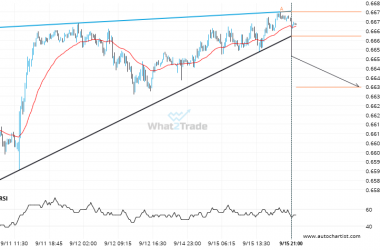
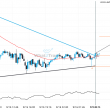
EUR/USD has broken through the resistance line of a Falling Wedge technical chart pattern. Because we have seen it retrace from this line in the past, one should wait for confirmation of the breakout before taking any action. It has touched this line twice in the last 13 days and suggests a possible target level to be around 1.1100 within the next 2 days.
Related Posts
After testing the support line numerous times, GBPUSD is once again approaching this line. Can we expect a bearish trend to follow?
GBPUSD is heading towards the support line of a Falling Wedge and could reach this point within the…
After experiencing a 8.65% bearish move in the space of 14 days, nobody knows where AUDJPY is headed.
Those of you that are trend followers are probably eagerly watching AUDJPY to see if its latest 8.65%…
Important price line breached by USDJPY. This price has been tested numerous times before.
USDJPY is once again retesting a key horizontal support level at 145.0465. It has tested this level 3…