
ETHBTC has broken through the resistance line of a Triangle technical chart pattern. Because we have seen it retrace from this line in the past, one should wait for confirmation of the breakout before taking any action. It has touched this line twice in the last 10 days and suggests a possible target level to be around 0.0676 within the next 3 days.
Related Posts
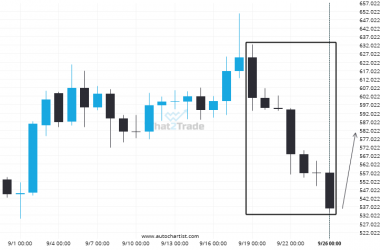
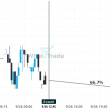
BCHUSD recorded 7 consecutive daily bearish candles reaching 536.0100.
BCHUSD experienced a high number of bearish candles reaching 536.0100 over 8 days.
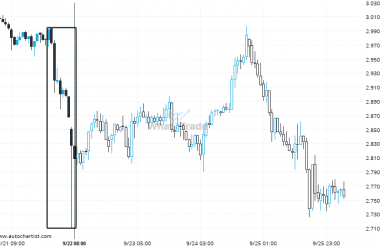
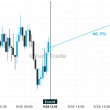
XRPUSD reached 2.808 after a 6.15% move spanning 10 hours.
XRPUSD recorded a considerable move in the last 10 hours — one of its biggest in recent sessions.
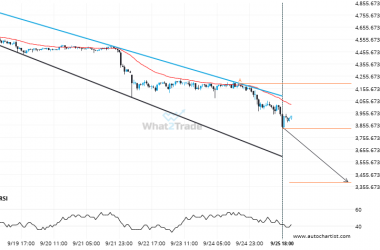
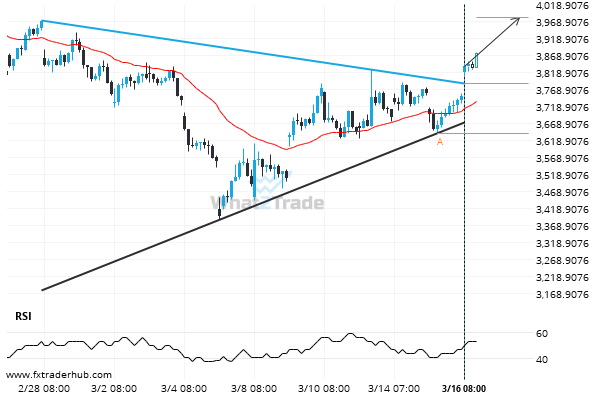
ETHUSD is quickly approaching the support line of a Channel Down. We expect either a breakout through this line or a rebound.
ETHUSD is moving towards a support line. Because we have seen it retrace from this line before, we…