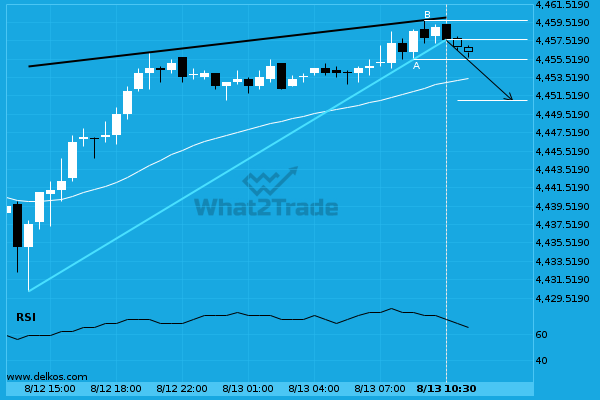
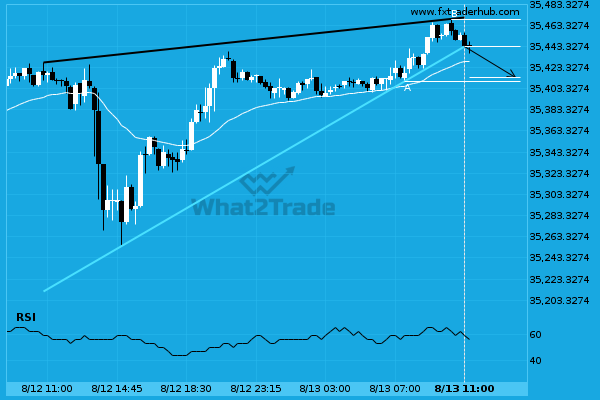
E-mini S&P 500 SEPTEMBER 2021 has broken through the support line of a Rising Wedge technical chart pattern. Because we have seen it retrace from this position in the past, one should wait for confirmation of the breakout before trading. It has touched this line twice in the last 20 hours and suggests a target line to be around 4451.0332 within the next 5 hours.
Related Posts
Silver Spot is signaling a possible trend reversal on the intraday charts with price not breaching support.
Silver Spot was identified at around 48.76785 having recently rebounded of the support on the 1 hour data…
Important price line breached by US Oil. This price has been tested numerous times before.
US Oil has broken through a resistance line. Because we have seen it retrace from this price in…
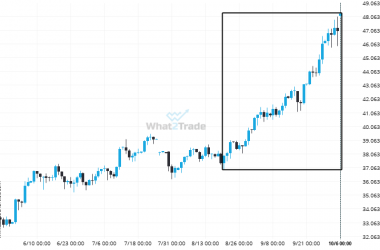
A very large move was recorded on Silver Spot. The size of the shift is exceptional.
Silver Spot just posted a 27.23% move over the past 48 days – a move that won’t go…

