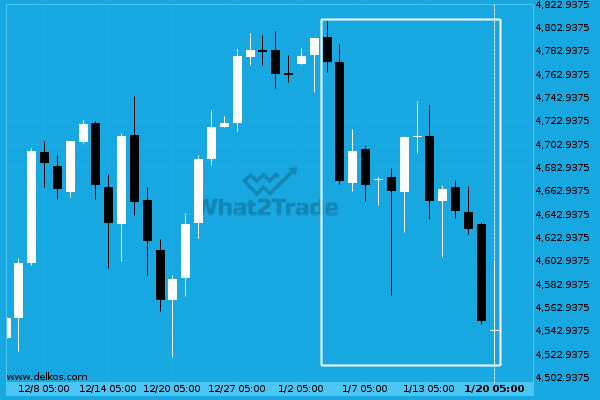
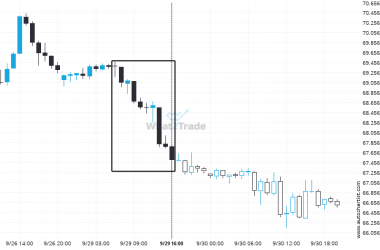
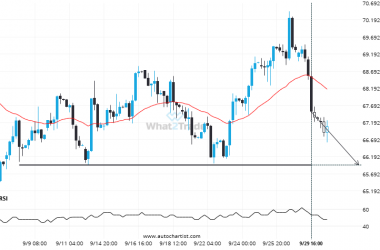
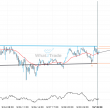
A movement of 4.8% over 17 days on E-mini S&P 500 MARCH 2022 doesn’t go unnoticed. You may start considering where it’s heading next, a continuation of the current downward trend, or a reversal in the previous direction.
Related Posts
Breach of resistance could mean a start of a bullish trend on US Oil
US Oil moved through the resistance line of a Triangle at 64.98008333333334 on the 4 hour chart. This…
Natural Gas has shown consistent movement in one direction.
Natural Gas posted 7 consecutive candles over the last 9 day — an unusually large movement.
US Oil keeps moving closer towards 64.8865. Will it finally breach this level?
US Oil is approaching a resistance line at 64.8865. If it hits the resistance line, it may break…