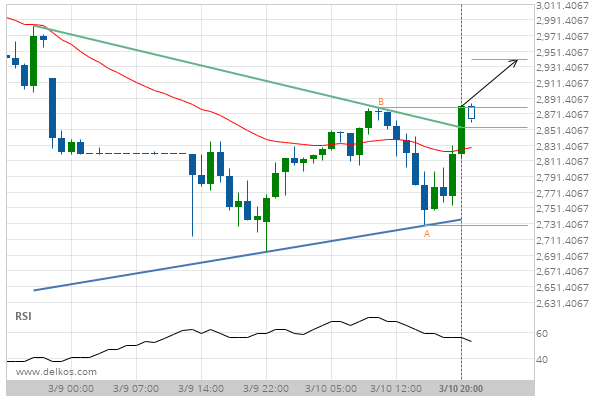
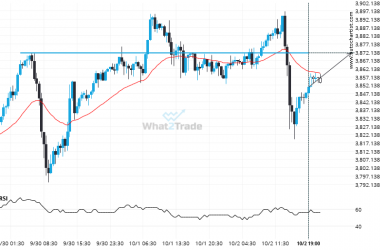
E-mini S&P 500 MARCH 2020 has broken through the resistance line of a Triangle. It has touched this line at least twice in the last 5 days. This breakout indicates a potential move to 2940.2233 within the next 14 hours. Because we have seen it retrace from this positions in the past, one should wait for confirmation of the breakout before trading.
E-mini S&P 500 MARCH 2020 has broken through resistance of a Triangle. It has touched this line at least twice in the last 5 days.