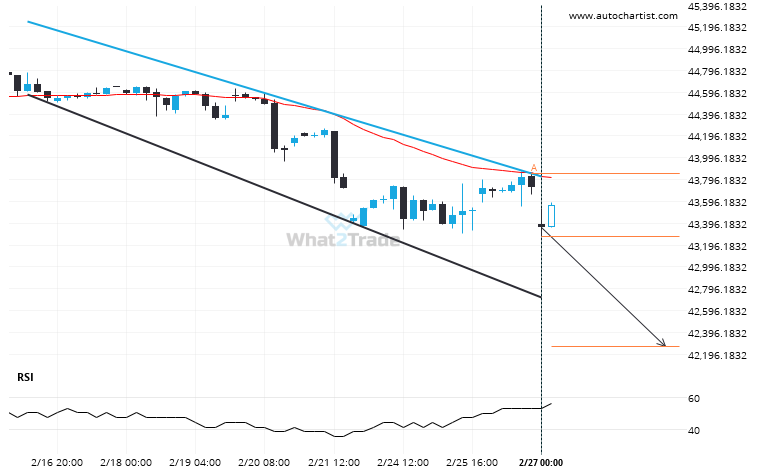
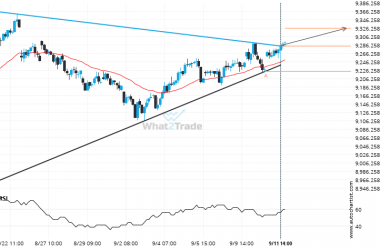
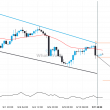
An emerging Channel Down has been detected on DOW 30 on the 4 hour chart. There is a possible move towards 42264.5721 next few candles. Once reaching resistance it may continue its bearish run or reverse back to current price levels.
Related Posts
FTSE 100 moves higher to 8830.28 in the last 65 days.
FTSE 100 hits 8830.28 after a 15.02% move spanning 65 days.
Because CAC 40 formed a Triangle pattern, we expect it to touch the resistance line. If it breaks through resistance it may move much higher
CAC 40 is approaching the resistance line of a Triangle. It has touched this line numerous times in…
Breach of 6008.0898 could mean a start of a bullish trend on US 500
US 500 has broken through 6008.0898 which it has tested numerous times in the past. We have seen…