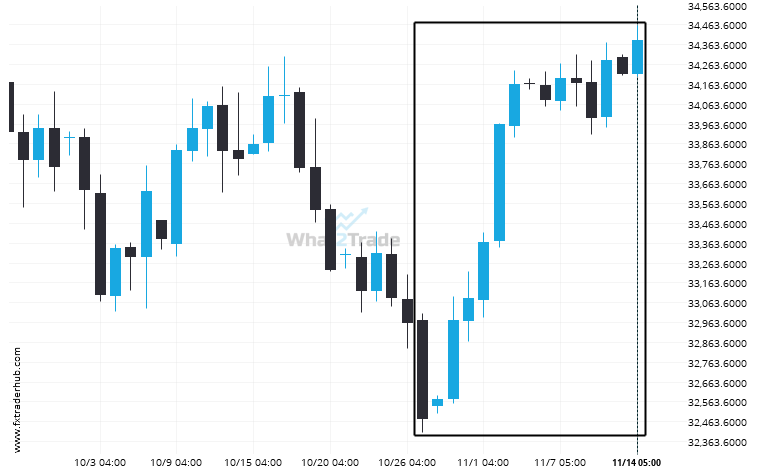
An unexpected large move has occurred on US30 Daily chart beginning at 32475.0 and ending at 34386.0. Is this a sign of something new? What can we expect in the future?
Related Posts
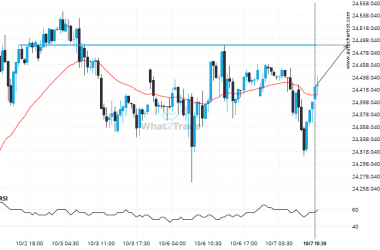
After testing 24489.3008 numerous times, DAX 40 is once again approaching this price point. Can we expect a bullish trend to follow?
The movement of DAX 40 towards 24489.3008 price line is yet another test of the line it reached…
NAS 100 – approaching a resistance line that has been previously tested at least twice in the past
The movement of NAS 100 towards the resistance line of a Rising Wedge is yet another test of…
Nikkei 225 reached 47590.0 after a 3.64% move spanning 3 days.
Nikkei 225 reached 47590.0 after a 3.64% move spanning 3 days.


