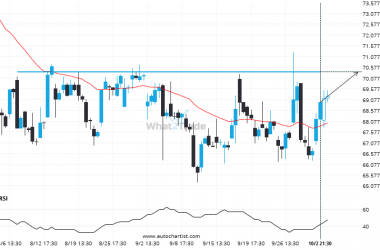
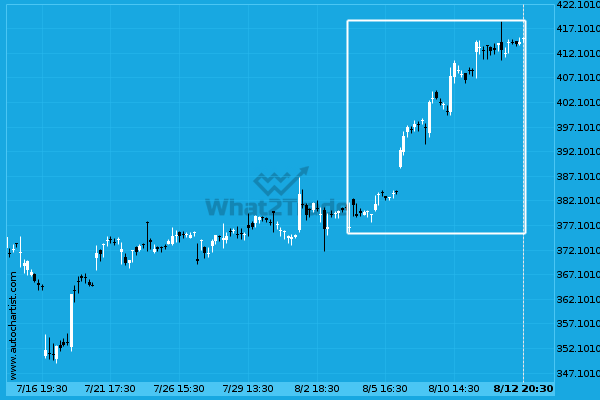
Goldman Sachs Group Inc. has experienced an exceptionally large movement higher by 10.2% from 376.57 to 414.99 in the last 9 days.
Related Posts
After experiencing 4 consecutive 4 hour bearish candles in the space of 5 days, nobody knows where INTC is headed.
Due to the rate of consecutive bearish candles on INTC 4 hour chart we could be in for…
BIDU has broken through a support line. It has touched this line numerous times in the last 22 days.
The breakout of BIDU through the 89.5800 price line is a breach of an important psychological price that…
A Channel Up has formed, NVDA is approaching support. Can we expect a breakout and the start of a new trend or a reversal?
Emerging Channel Up detected on NVDA – the pattern is an emerging one and has not yet broken…