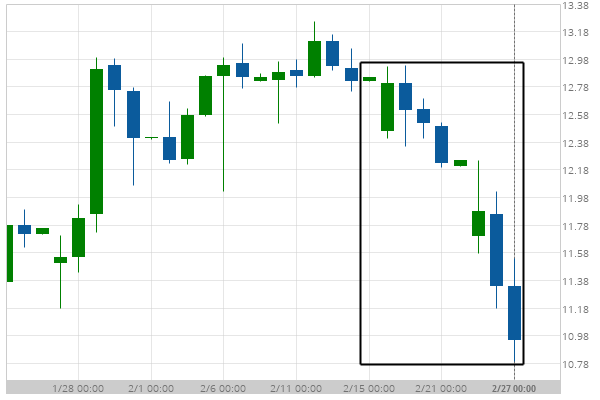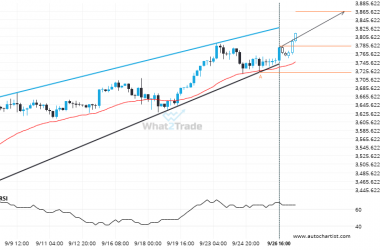
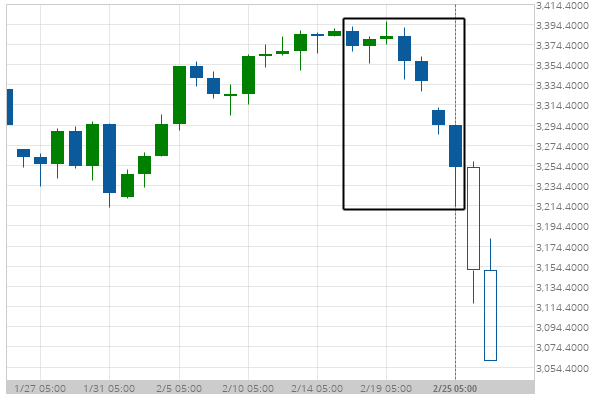
E-mini S&P 500 MARCH 2020 has experienced an exceptionally large movement lower by 3.98% from 3,387.5 to 3,252.75 in the last 9 days.
Could a large bearish move on E-mini S&P 500 MARCH 2020 be a sign of things to come?

E-mini S&P 500 MARCH 2020 has experienced an exceptionally large movement lower by 3.98% from 3,387.5 to 3,252.75 in the last 9 days.