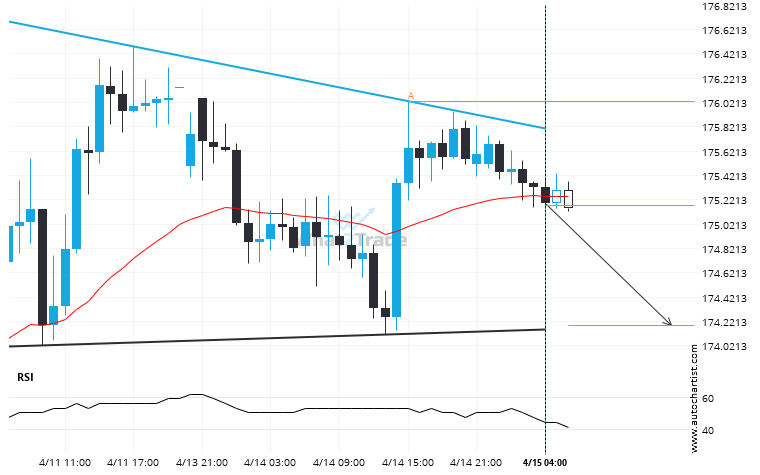
Emerging Descending Triangle pattern in its final wave was identified on the CHFJPY 1 hour chart. After a strong bearish run, we find CHFJPY heading towards the upper triangle line with a possible resistance at 174.1923. If the support shows to hold, the Descending Triangle pattern suggests a rebound back towards current levels.
Related Posts
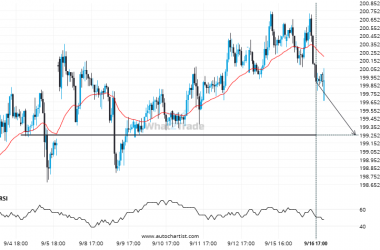
GBPJPY is approaching 199.2480. We expect either a breakout through this line, or a rebound.
A strong support level has been identified at 199.2480 on the 1 hour GBPJPY chart. GBPJPY is likely…
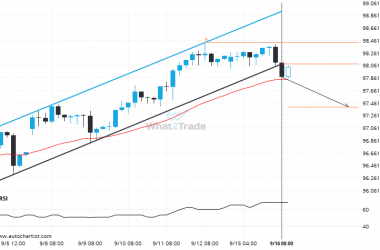
Breach of support could mean a start of a bearish trend on AUDJPY
AUDJPY has broken through a support line of a Channel Up chart pattern. If this breakout holds true,…
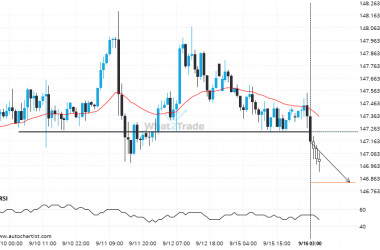
USDJPY has broken through a support line. It has touched this line numerous times in the last 7 days.
A strong support level has been breached at 147.2330 on the 1 hour USDJPY chart. Technical Analysis theory…

