


Browsing Category
US Stocks
6657 posts
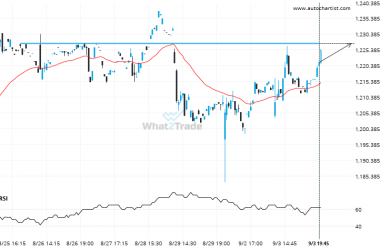
If you’re short NFLX you should be aware of the rapidly approaching level of 1227.4800
NFLX is moving towards a resistance line. Because we have seen it retrace from this level in the…
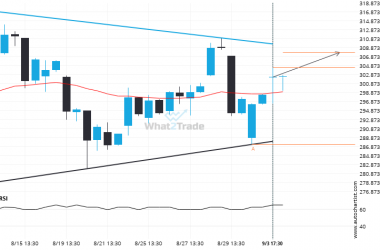
Because AVGO formed a Triangle pattern, we expect it to touch the resistance line. If it breaks through resistance it may move much higher
Emerging Triangle detected on AVGO – the pattern is an emerging one and has not yet broken through…
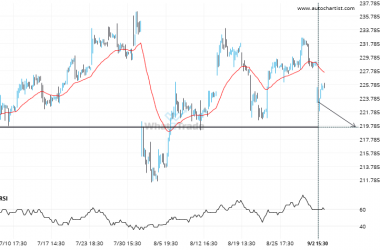
Important price line being approached by AMZN. This price has been tested numerous times before.
A strong support level has been identified at 219.5600 on the 1 hour AMZN chart. AMZN is likely…
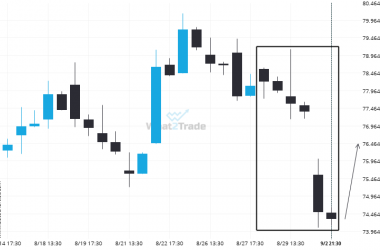
Large bearish move on NKE.
Rare candle sequence recorded on the NKE 4 hour chart, ending at 74.3100.
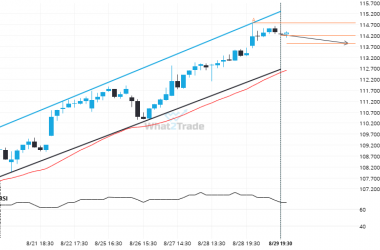
PYPL – approaching a support line that has been previously tested at least twice in the past
PYPL is heading towards the support line of a Rectangle and could reach this point within the next…
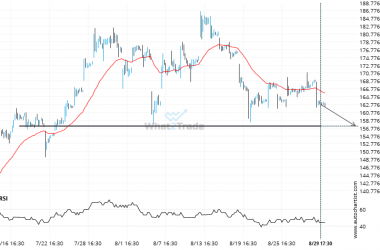
If AMD touches 157.2200 it may be time to take action.
AMD is about to retest a key horizontal support level near 157.2200. It has tested this level 4…
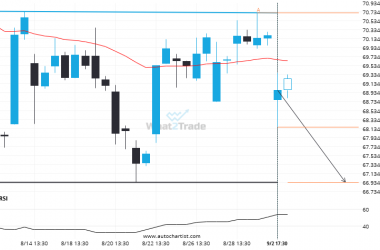
A possible move on XOM as it heads towards support
XOM was identified at around 114.195 having recently rebounded of the resistance on the 1 hour data interval.…
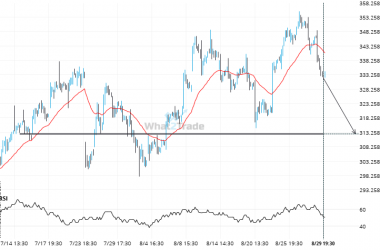
If you’re long TSLA you should be aware of the rapidly approaching level of 312.7200
TSLA is approaching a support line at 312.7200. If it hits the support line, it may break through…
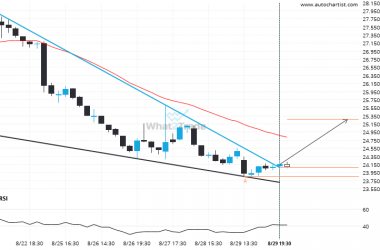
A possible move by MRNA towards 25.2638
The last 9 1 hour candles on MRNA formed a Falling Wedge pattern and broken out through the…
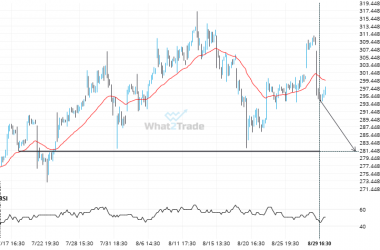
AVGO heading towards a price it has tested 3 times in the recent past.
AVGO is heading towards 281.1250 and could reach this point within the next 3 days. It has tested…