


Browsing Category
US Stocks
6657 posts
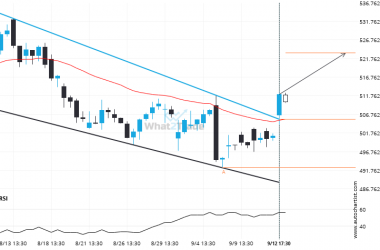
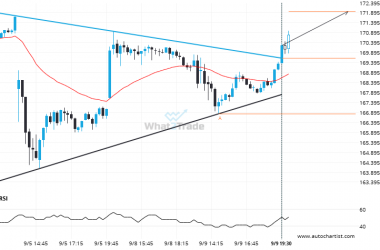
Resistance line breached by MSFT. This price has been tested at least twice before.
MSFT has broken through a resistance line of a Channel Down chart pattern. If this breakout holds true,…

MRNA breakout from a Ascending Triangle trade setup. Will it continue this trend to hit the target price?
This trade setup on MRNA is formed by a period of consolidation; a period in which the price…

NVDA is quickly approaching a very important level it has previously tested numerous times in the past
NVDA is heading towards 184.4200 and could reach this point within the next 15 hours. It has tested…

GOOGL formed a Channel Up on the 1 hour chart. Retest of resistance in sight.
GOOGL is heading towards the resistance line of a Channel Up and could reach this point within the…
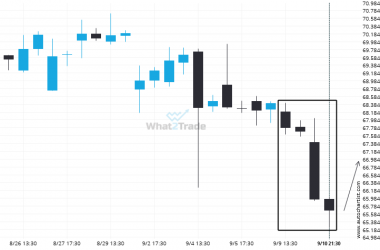
PYPL moves lower to 65.6650 in the last 2 days.
Rare candle sequence recorded on the PYPL 4 hour chart, ending at 65.6650.
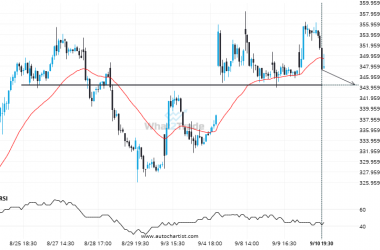
TSLA heading towards a price it has tested 5 times in the recent past.
The movement of TSLA towards 344.4200 price line is yet another test of the line it reached numerous…
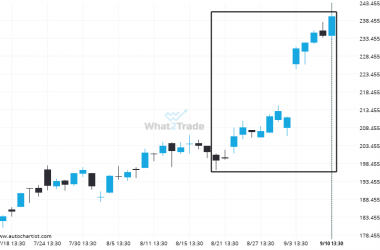
Extreme movement experienced on GOOGL. Check the chart to see what to do next.
GOOGL has moved higher by 20.22% from 199.31 to 239.61 in the last 22 days.
Resistance line breached by NVDA. This price has been tested at least twice before.
NVDA has broken through a resistance line. It has touched this line at least twice in the last…

BABA recorded 6 consecutive 4 hour bullish candles.
BABA posted 6 consecutive candles over the last 5 day — an unusually large movement.
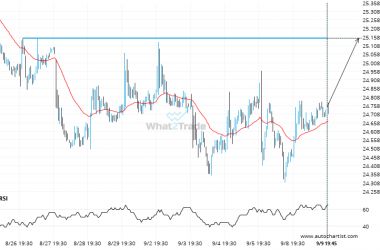
A final push possible on PFE as it starts approaching a price line of 25.1500.
PFE is moving towards a key resistance level at 25.1500. This is a previously tested level for PFE.…