


Browsing Category
US Stocks
6657 posts
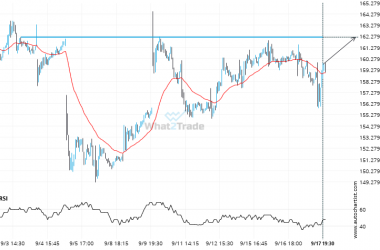
AMD keeps moving closer towards 162.2200. Will it finally breach this level?
AMD is en route to a very important line that will be a definite deciding factor of what…
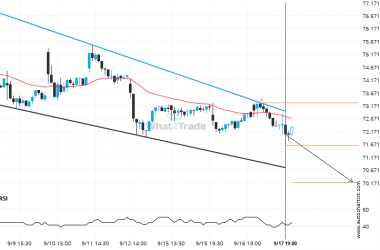
NKE – approaching a support line that has been previously tested at least twice in the past
Emerging Falling Wedge detected on NKE – the pattern is an emerging one and has not yet broken…
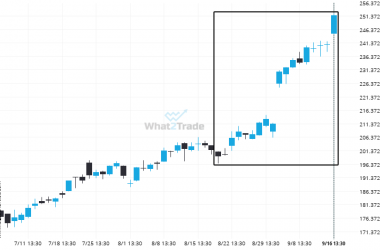
An unexpected large move occurred on GOOGL Daily chart. The shift stands out in recent activity.
GOOGL just posted a 26.23% move over the past 28 days – a move that won’t go unnoticed…
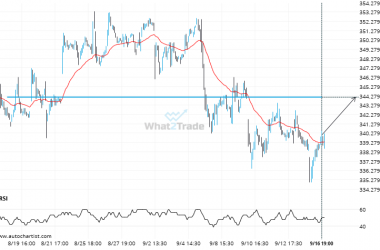
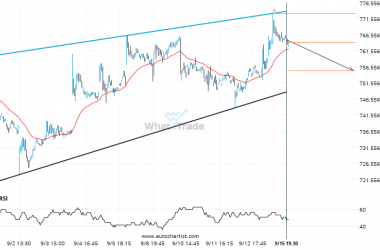
If you’re short V you should be aware of the rapidly approaching level of 344.1500
V is heading towards a line of 344.1500. If this movement continues, the price of V could test…
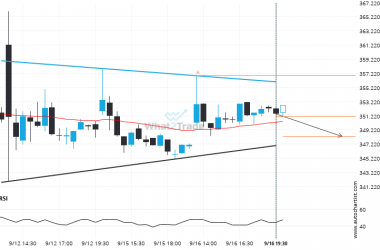
ADBE is approaching a support line of a Triangle. It has touched this line numerous times in the last 6 days.
An emerging Triangle has been detected on ADBE on the 30 Minutes chart. There is a possible move…
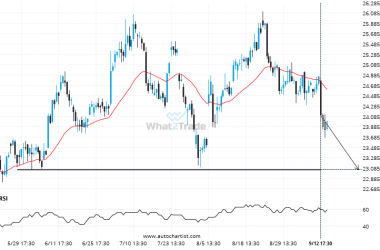
Will PFE break through the support level it tested before?
PFE is heading towards 23.0550 and could reach this point within the next 3 days. It has tested…
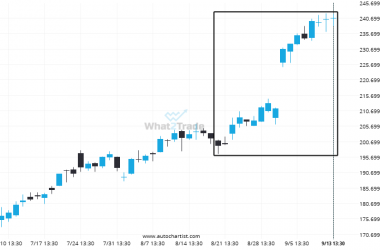
Big bullish swing on GOOGL – this may be one of its more notable movements in the recent session.
A movement of 20.79% over 25 days on GOOGL doesn’t go unnoticed. You may start considering where it’s…
META – approaching a support line that has been previously tested at least twice in the past
Emerging Rising Wedge detected on META – the pattern is an emerging one and has not yet broken…
AMZN seems to be on its way to support – a possible opportunity?
AMZN is moving towards a support line. Because we have seen it retrace from this level in the…
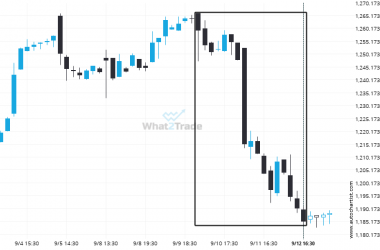
NFLX reached 1185.06 after a 5.9% move spanning 3 days.
NFLX has moved lower by 5.9% from 1259.325 to 1185.06 in the last 3 days.