
Browsing Category
US Stocks
6612 posts
NVDA – It’s perhaps in these huge moves where the greatest opportunity lies
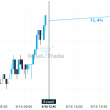
NVDA hits 116.64 after a 18.21% move spanning 12 days.
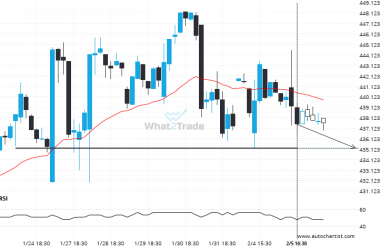
ADBE – approaching a price line that has been previously tested numerous times in the past
The movement of ADBE towards 435.2100 price line is yet another test of the line it reached numerous…
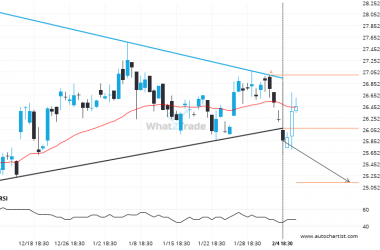
PFE breakout from a Triangle trade setup. Will it continue this trend to hit the target price?
PFE has broken through the support line of a Triangle technical chart pattern. Because we have seen it…
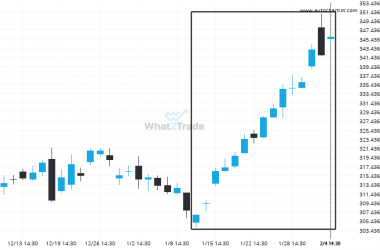
V hits 345.81 after a 12.75% move spanning 23 days
Those of you that are trend followers are probably eagerly watching V to see if its latest 12.75%…
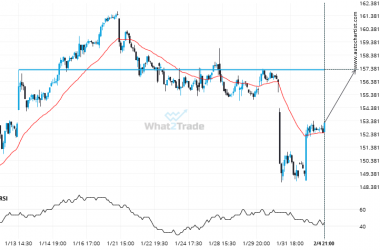
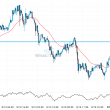
After testing 157.2650 numerous times, CVX is once again approaching this price point. Can we expect a bullish trend to follow?
The movement of CVX towards 157.2650 price line is yet another test of the line it reached numerous…
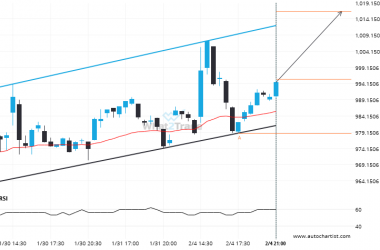
NFLX is signaling a possible trend reversal on the intraday charts with price not breaching support.
NFLX was identified at around 995.5 having recently rebounded of the support on the 30 Minutes data interval.…
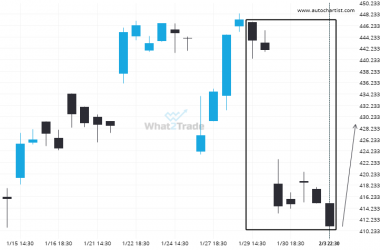
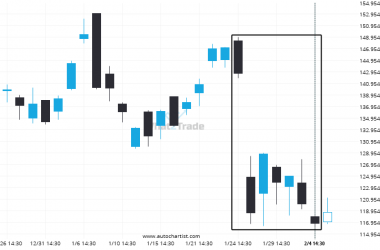
Could 7 consecutive 4 hour bearish candles on MSFT be a sign of things to come?
After posting 7 consecutive bearish candles in 6 days, you may start considering where MSFT is heading next,…
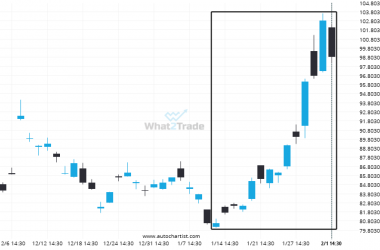
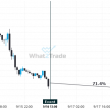
BABA moves higher to 98.81 in the last 20 days.
A movement of 22.67% over 20 days on BABA doesn’t go unnoticed. You may start considering where it’s…
A final push possible on BIDU as it starts approaching a price line of 82.4900.
BIDU is moving towards a support line. Because we have seen it retrace from this level in the…
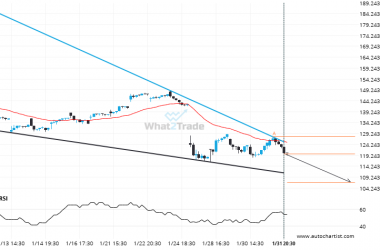
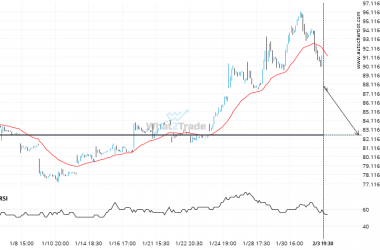
NVDA is approaching a support line of a Falling Wedge. It has touched this line numerous times in the last 25 days.
Emerging Falling Wedge detected on NVDA – the pattern is an emerging one and has not yet broken…