
Browsing Category
US Stocks
6611 posts
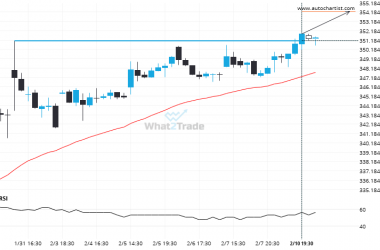
V has broken through a level it has tested 3 times in the recent past.
The breakout of V through the 351.0800 price line is a breach of an important psychological price that…
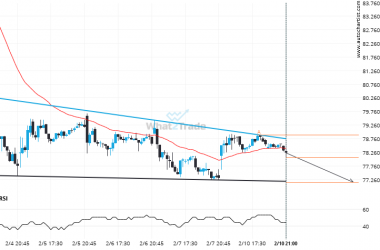
PYPL – approaching a support line that has been previously tested at least twice in the past
The movement of PYPL towards the support line of a Descending Triangle is yet another test of the…
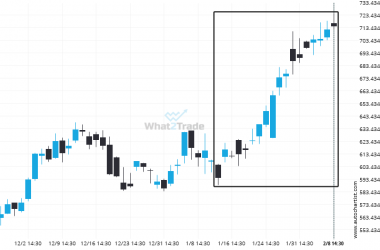
META – It’s perhaps in these huge moves where the greatest opportunity lies
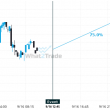
META has moved higher by 20.19% from 594.32 to 714.34 in the last 26 days.
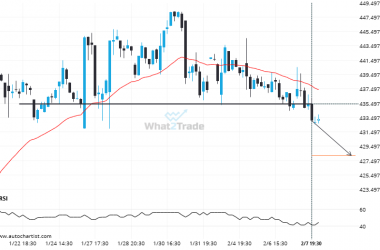
After trying numerous times in the past, ADBE finally breaks 435.4100!
The breakout of ADBE through the 435.4100 price line is a breach of an important psychological price that…
NFLX formed a Channel Up on the 15 Minutes chart. Retest of support in sight.
Emerging Channel Up detected on NFLX – the pattern is an emerging one and has not yet broken…
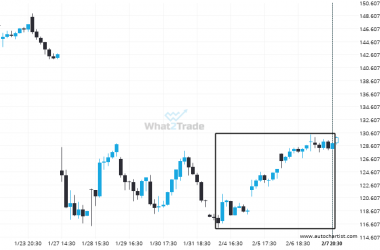
Is the extremely large movement on NVDA a sign of things to come?
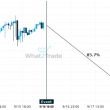
NVDA has moved higher by 10.55% from 116.64 to 128.945 in the last 5 days.
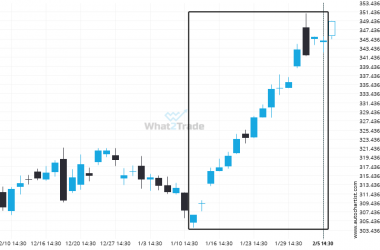
V moves higher to 345.04 in the last 24 days.
V has moved higher by 12.5% from 306.7 to 345.04 in the last 24 days.
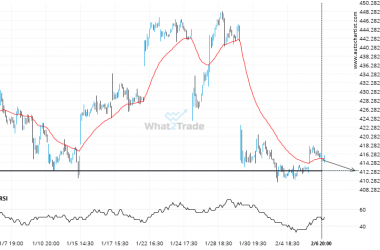
Important price line being approached by MSFT. This price has been tested numerous times before.
MSFT is moving towards a key support level at 412.4000. This is a previously tested level for MSFT.…
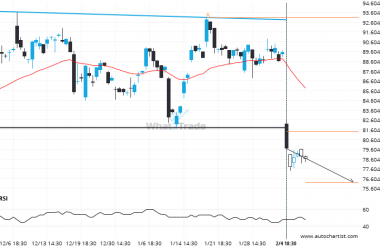
A possible move by PYPL towards 76.2042
This trade setup on PYPL is formed by a period of consolidation; a period in which the price…
NVDA – It’s perhaps in these huge moves where the greatest opportunity lies
NVDA hits 116.64 after a 18.21% move spanning 12 days.