
Browsing Category
US Stocks
6611 posts
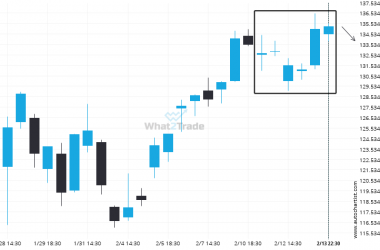
AAPL is signaling a possible trend reversal on the intraday charts with price not breaching support.
AAPL is trapped in a Channel Up formation, implying that a breakout is Imminent. This is a great…
NVDA consistently settling in one direction. Will it continue?
Due to the rate of consecutive bullish candles on NVDA 4 hour chart we could be in for…
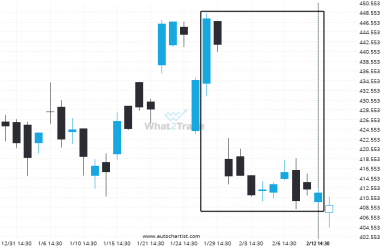
MSFT – It’s perhaps in these huge moves where the greatest opportunity lies
A movement of 7.98% over 16 days on MSFT doesn’t go unnoticed. You may start considering where it’s…
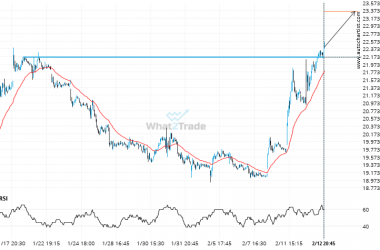
It’s time to make a decision on INTC – its recent breach of 22.1600 could be a sign of a new trend to follow.
INTC is once again retesting a key horizontal resistance level at 22.1600. It has tested this level 4…
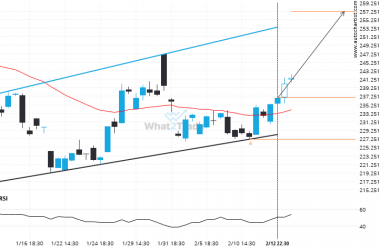
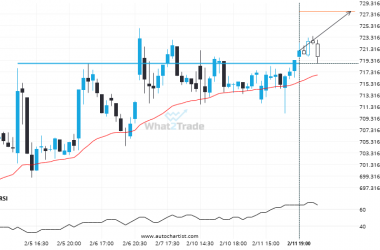
Because NFLX formed a Channel Up pattern, we expect it to touch the resistance line. If it breaks through resistance it may move much higher
A Channel Up pattern was identified on NFLX at 1016.97, creating an expectation that it may move to…
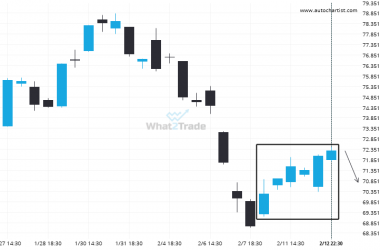
Rare set of bullish consecutive candles on the NKE 4 hour chart. Can we expect a turn-around?
Rare set of consecutive candles on the NKE 4 hour chart. Could we expect a turn around from…
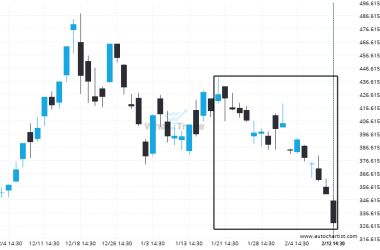
TSLA moves lower to 328.495 in the last 27 days.
An unexpected large move has occurred on TSLA Daily chart beginning at 426.55 and ending at 328.495. Is…
If you’re short META you should be aware that 718.8200 has just been breached – a level tested 4 time in the past
The breakout of META through the 718.8200 price line is a breach of an important psychological price that…
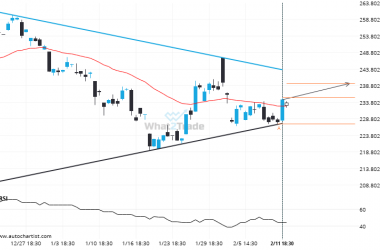
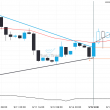
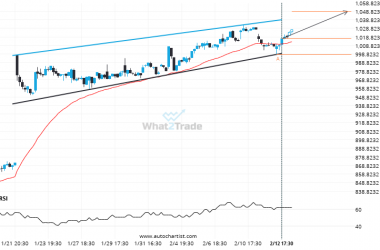
Because AAPL formed a Triangle pattern, we expect it to touch the resistance line. If it breaks through resistance it may move much higher
AAPL is approaching the resistance line of a Triangle. It has touched this line numerous times in the…
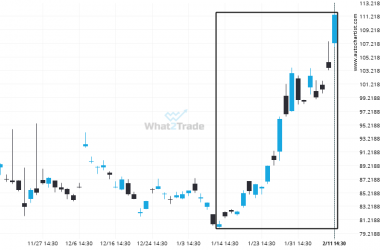
Could a large bullish move on BABA be a sign of things to come?
BABA hits 111.37 after a 38.26% move spanning 30 days.