


Browsing Category
US Stocks
6606 posts
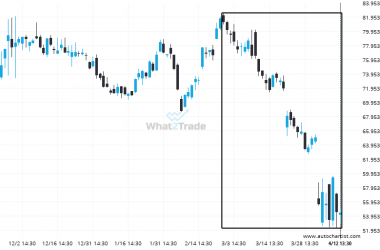
After experiencing a 33% bearish move in the space of 45 days, nobody knows where NKE is headed.
A movement of 33% over 45 days on NKE doesn’t go unnoticed. You may start considering where it’s…
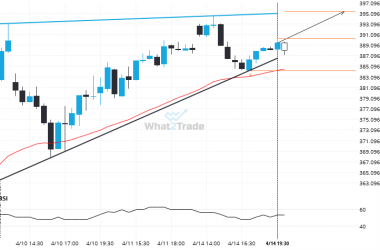
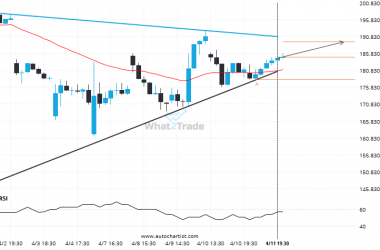
MSFT is quickly approaching the resistance line of a Ascending Triangle. We expect either a breakout through this line or a rebound.
MSFT is approaching the resistance line of a Ascending Triangle. It has touched this line numerous times in…
V likely to test 353.2600 in the near future. Where to next?
V is moving towards a key resistance level at 353.2600. V has previously tested this level 5 times…
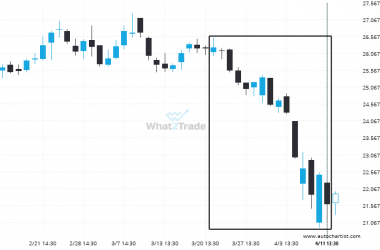
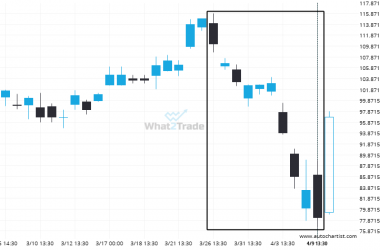
Extreme movement experienced on PFE. Check this chart to see what to do next
PFE has experienced an extremely big movement in last 21 days. It may continue the trend, but this…
A Triangle has formed, AMZN is approaching support. Can we expect a breakout and the start of a new trend or a reversal?
AMZN is moving towards a resistance line. Because we have seen it retrace from this line before, we…
AVGO through 179.82032608695653. Is this a confirming a breakout? Will it continue its path in the current trend toward 203.4274?
AVGO moved through the resistance line of a Channel Down at 179.82032608695653 on the 4 hour chart. This…
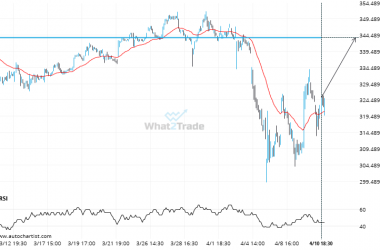
AMD moves lower to 78.26 in the last 15 days.
Those of you that are trend followers are probably eagerly watching AMD to see if its latest 28.98%…
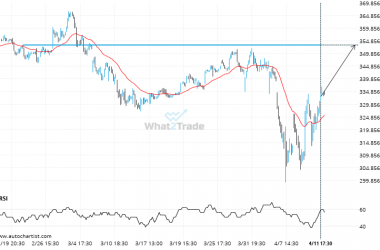
Important price line being approached by V. This price has been tested numerous times before.
V is moving towards a key resistance level at 343.7500. V has previously tested this level 3 times…
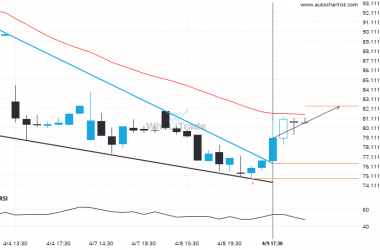
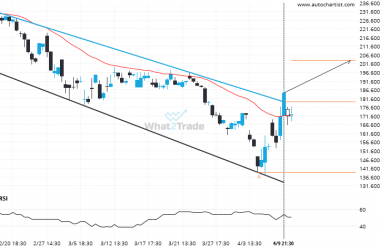
Breach of resistance could mean a start of a bullish trend on BIDU
BIDU moved through the resistance line of a Falling Wedge at 76.3833333333333 on the 1 hour chart. This…
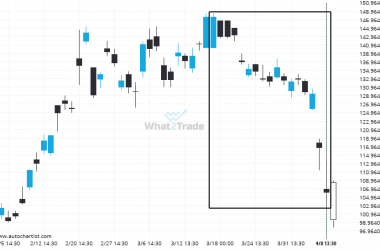
BABA – It’s perhaps in these huge moves where the greatest opportunity lies
A movement of 28.24% over 23 days on BABA doesn’t go unnoticed. You may start considering where it’s…