


Browsing Category
US Stocks
6606 posts
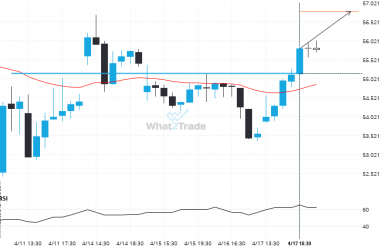
If you’re short NKE you should be aware that 55.1550 has just been breached – a level tested 3 time in the past
NKE has broken through a line of 55.1550 and suggests a possible movement to 56.7955 within the next…
After testing resistance twice in the past, META has finally broken through. Can we expect a bullish trend to follow?
META has broken through a resistance line. It has touched this line at least twice in the last…
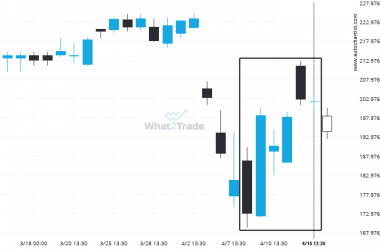
Is the extremely large movement on AAPL a sign of things to come?
AAPL has moved higher by 16.98% from 172.81 to 202.15 in the last 9 days.
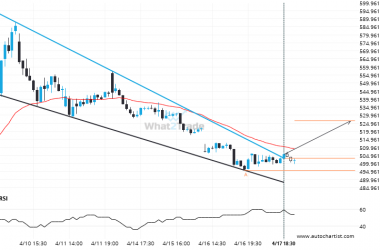
Will AVGO break through the support level it tested before?
AVGO is moving towards a line of 164.9200 which it has tested numerous times in the past. We…
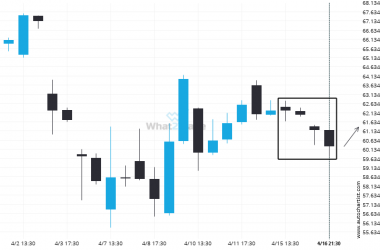
PYPL experienced 4 consecutive 4 hour bearish candles to reach a price of 60.2700
Trend followers are probably eagerly watching PYPL to see if its latest 4 consecutive candles continues. If not,…
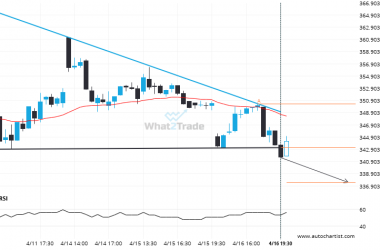
ADBE through 343.1272972972973. Is this a confirming a breakout? Will it continue its path in the current trend toward 337.4472?
ADBE moved through the support line of a Descending Triangle at 343.1272972972973 on the 30 Minutes chart. This…
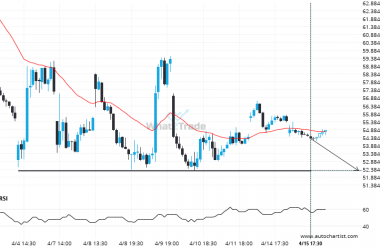
Will NKE break through the support level it tested before?
NKE is heading towards a line of 52.2800. If this movement continues, the price of NKE could test…
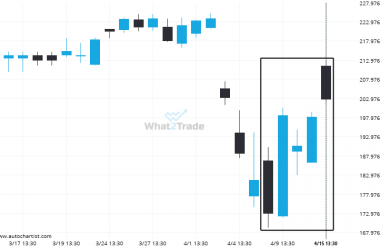
Extreme movement experienced on AAPL. Check this chart to see what to do next
AAPL rose sharply for 7 days – which is an excessively big movement for this instrument; exceeding the…
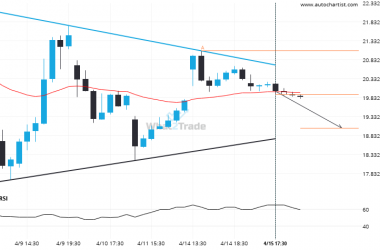
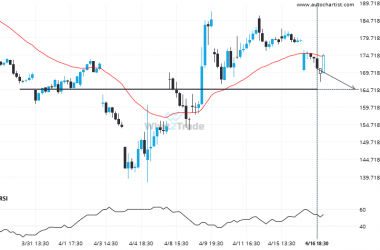
INTC is approaching a support line of a Triangle. It has touched this line numerous times in the last 8 days.
The movement of INTC towards the support line of a Triangle is yet another test of the line…
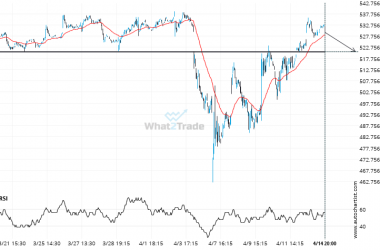
If you’re long BRK.B you should be aware of the rapidly approaching level of 520.8000
BRK.B is moving towards a key support level at 520.8000. BRK.B has previously tested this level 4 times…