


Browsing Category
US Stocks
6657 posts
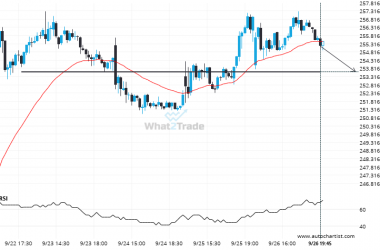
AAPL – approaching a price line that has been previously tested numerous times in the past
AAPL is heading towards a line of 253.6100. If this movement continues, the price of AAPL could test…
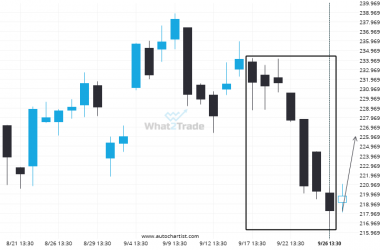
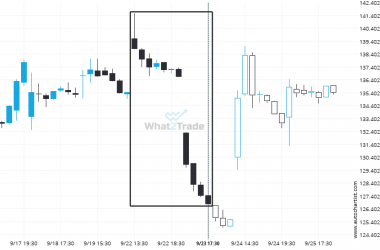
AMZN posted 7 consecutive bearish Daily candles.
AMZN moved lower from 233.7700 to 218.1650 after 7 consecutive daily candles over 10 days.
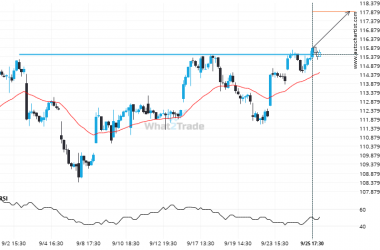
XOM – breach of price line that’s been previously tested numerous times before
XOM has breached the resistance line at 115.4800. It may continue the bullish trend towards 117.9020, or, it…
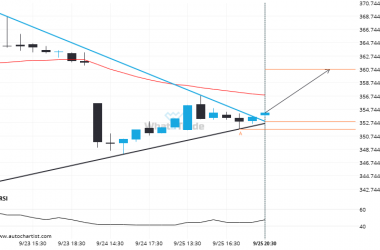
ADBE has broken through resistance of a Triangle. It has touched this line at least twice in the last 8 days.
This trade setup on ADBE is formed by a period of consolidation; a period in which the price…
BIDU moves lower to 126.73 in the last 2 days.
BIDU reached 126.73 after a 8.68% move spanning 2 days.
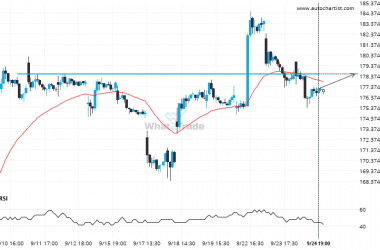
NVDA is approaching 178.5900. We expect either a breakout through this line, or a rebound.
NVDA is en route to a very important line that will be a definite deciding factor of what…
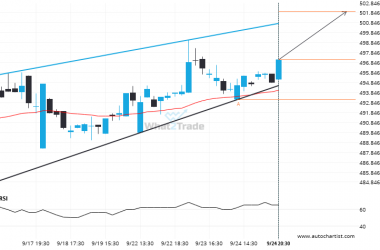
Because BRK.B formed a Rising Wedge pattern, we expect it to touch the resistance line. If it breaks through resistance it may move much higher
Emerging Rising Wedge detected on BRK.B – the pattern is an emerging one and has not yet broken…
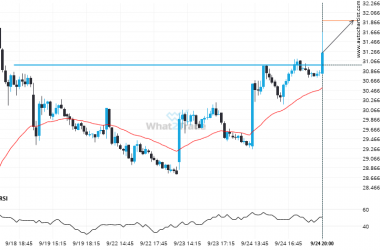
INTC is currently testing a level of 30.9800. Will the breakout continue or will things reverse?
INTC has broken through 30.9800 which it has tested numerous times in the past. We have seen it…
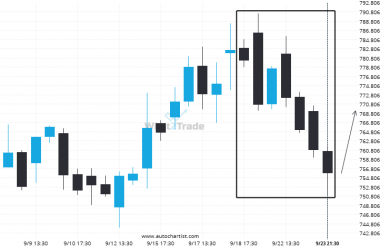
META recorded 5 consecutive 4 hour bearish candles reaching 755.6900.
META experienced an unusual number of bearish candles on the 4 hour timeframe.
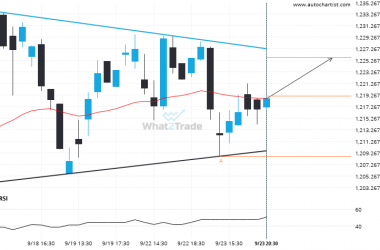
Important resistance line being approached by NFLX. This price has been tested numerous time in the last 9 days
Emerging Pennant pattern in its final wave was identified on the NFLX 1 hour chart. After a strong…