


Browsing Category
US Stocks
6606 posts
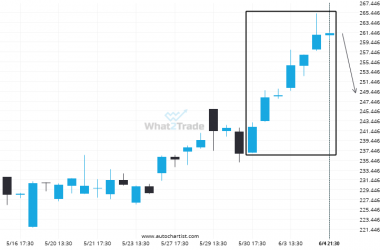
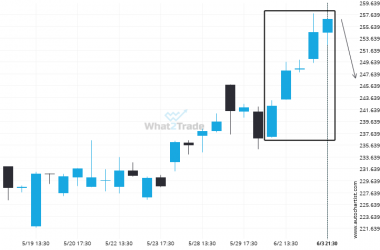
Is the AVGO poised for a turn-around after 7 consecutive bullish 4 hour candles?
After posting 7 consecutive bullish candles in 6 days, you may start considering where AVGO is heading next,…
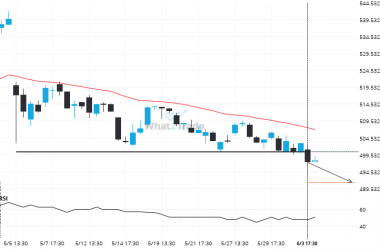
A possible move on XOM as it heads towards support
XOM is heading towards the support line of a Falling Wedge. If this movement continues, the price of…
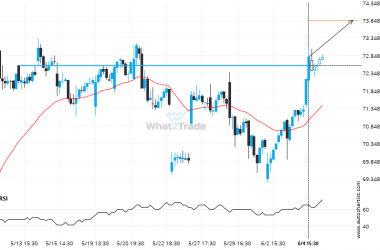
Important price line breached by PYPL. This price has been tested numerous times before.
The breakout of PYPL through the 72.5600 price line is a breach of an important psychological price that…
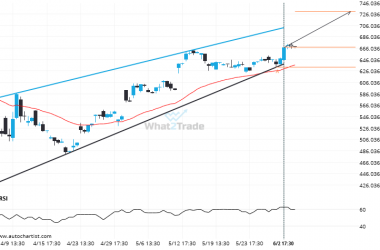
META is approaching a resistance line of a Rising Wedge. It has touched this line numerous times in the last 57 days.
Emerging Rising Wedge pattern in its final wave was identified on the META 4 hour chart. After a…
After experiencing 5 consecutive 4 hour bullish candles in the space of 5 days, nobody knows where AVGO is headed.
AVGO has experienced an unusual quantity of bullish candles on the 4 hour timeframe. This is in the…
It’s time to make a decision on BRK.B – its recent breach of 500.4800 could be a sign of a new trend to follow.
BRK.B has broken through a support line. Because we have seen it retrace from this price in the…
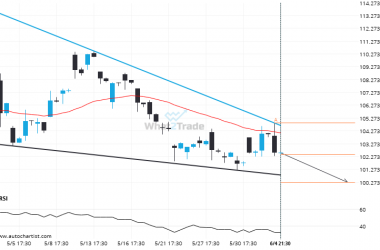
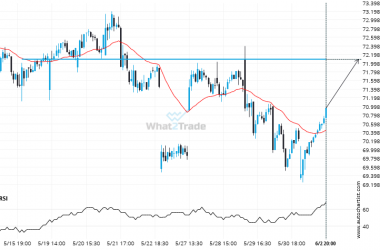
XOM – approaching a support line that has been previously tested at least twice in the past
XOM is approaching the support line of a Channel Down. It has touched this line numerous times in…
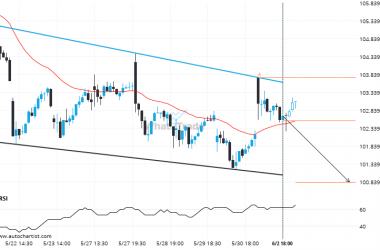
If you’re short PYPL you should be aware of the rapidly approaching level of 72.0900
The price of PYPL in heading back to the resistance area. It is possible that it will struggle…
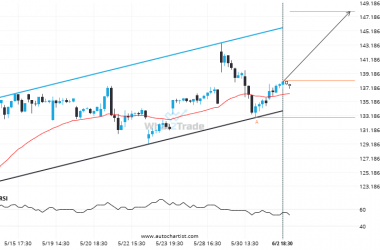
Important resistance line being approached by NVDA. This price has been tested numerous time in the last 27 days
The movement of NVDA towards the resistance line of a Channel Up is yet another test of the…
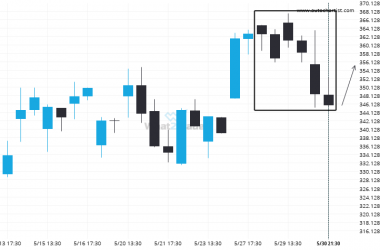
TSLA hits 345.7600 after a run of 6 consecutive 4 hour candles spanning 3 days.
For those of you that don’t believe in trends, this may be an opportunity to take advantage of…