


Browsing Category
US Stocks
6606 posts
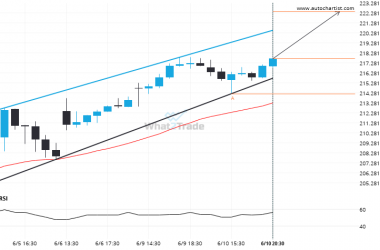
Important resistance line being approached by AMZN. This price has been tested numerous time in the last 8 days
AMZN was identified at around 217.68 having recently rebounded of the support on the 1 hour data interval.…

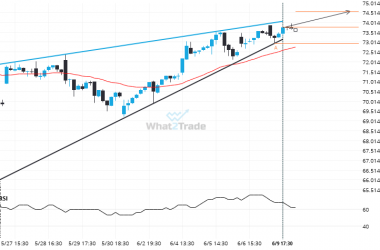
CVX may be on a start of a new bullish trend after its breakout through this important resistance level
CVX has broken through 140.6100 which it has tested numerous times in the past. We have seen it…
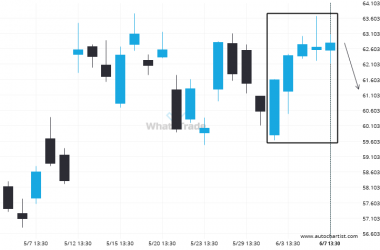
NKE has formed 5 bullish candles successively, what is the probability of getting another bullish candle?
NKE has experienced an exceptionally large amount of consecutive bullish candles to reach a price of 62.8000 in…
PYPL is approaching a resistance line of a Rising Wedge. It has touched this line numerous times in the last 18 days.
Emerging Rising Wedge detected on PYPL – the pattern is an emerging one and has not yet broken…
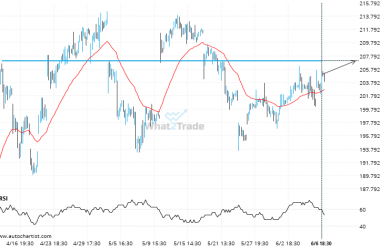
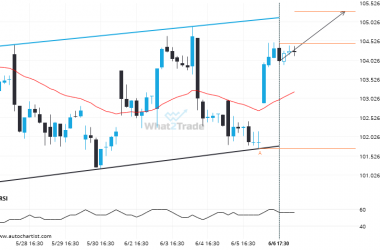
If AAPL touches 207.0400 it may be time to take action.
AAPL is en route to a very important line that will be a definite deciding factor of what…
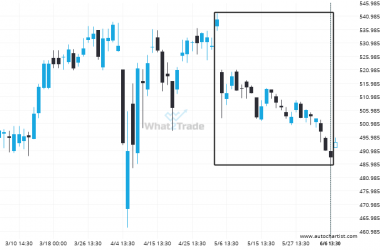
Is the extremely large movement on BRK.B a sign of things to come?
BRK.B has experienced an extremely big movement in last 35 days. It may continue the trend, but this…
Because XOM formed a Channel Up pattern, we expect it to touch the resistance line. If it breaks through resistance it may move much higher
XOM is heading towards the resistance line of a Channel Up and could reach this point within the…
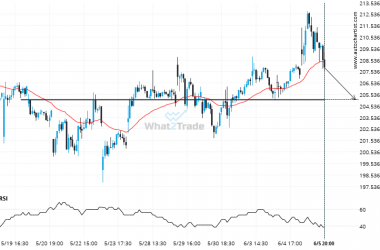
AMZN seems to be on its way to support – a possible opportunity?
AMZN is heading towards a line of 205.0600. If this movement continues, the price of AMZN could test…
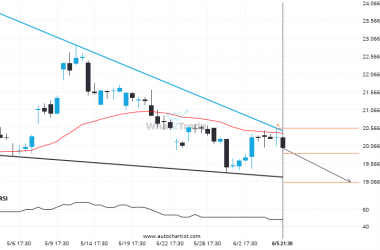
After testing the support line numerous times, INTC is once again approaching this line. Can we expect a bearish trend to follow?
INTC is heading towards the support line of a Falling Wedge. If this movement continues, the price of…
Is the extremely large movement on BRK.B a sign of things to come?
Those of you that are trend followers are probably eagerly watching BRK.B to see if its latest 9%…