


Browsing Category
US Stocks
6606 posts
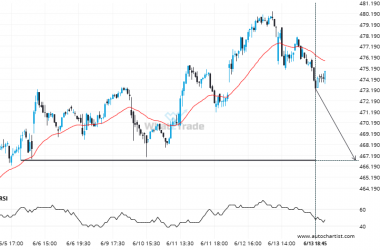
MSFT seems to be on its way to support – a possible opportunity?
MSFT is moving towards a line of 466.7500 which it has tested numerous times in the past. We…
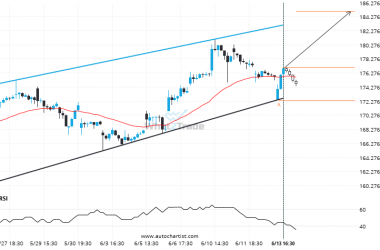
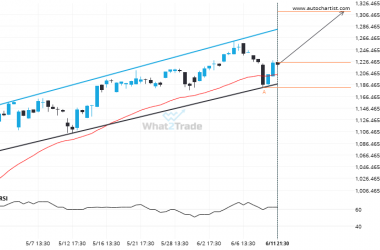
Because GOOGL formed a Channel Up pattern, we expect it to touch the resistance line. If it breaks through resistance it may move much higher
An emerging Channel Up has been detected on GOOGL on the 1 hour chart. There is a possible…
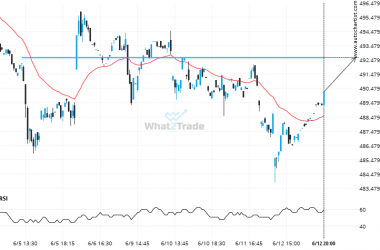
BRK.B heading towards a price it has tested 4 times in the recent past.
The movement of BRK.B towards 492.6200 price line is yet another test of the line it reached numerous…
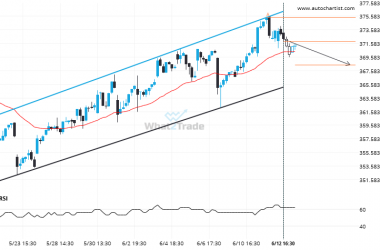
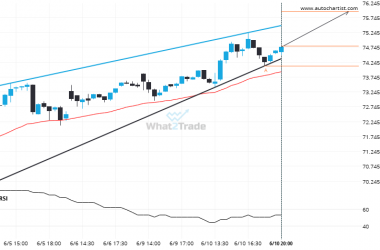
A possible move on V as it heads towards support
The movement of V towards the support line of a Channel Up is yet another test of the…
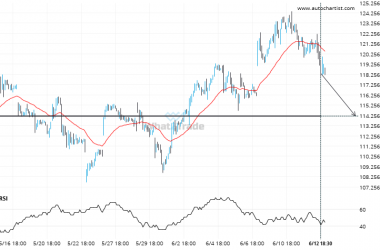
If you’re long AMD you should be aware of the rapidly approaching level of 114.2000
AMD is approaching a support line at 114.2000. If it hits the support line, it may break through…
NFLX is quickly approaching the resistance line of a Channel Up. We expect either a breakout through this line or a rebound.
NFLX is moving towards a resistance line which it has tested numerous times in the past. We have…
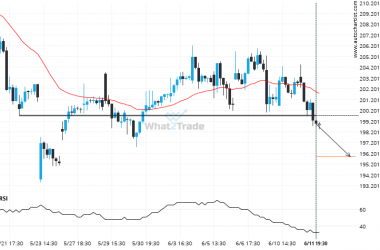
Important price line breached by AAPL. This price has been tested numerous times before.
A strong support level has been breached at 199.7100 on the 1 hour AAPL chart. Technical Analysis theory…
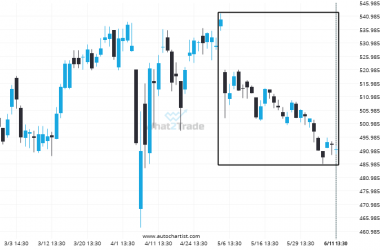
BRK.B experienced a very large 41 days bearish move to 491.38
BRK.B dropped sharply for 40 days – which is an excessively big movement for this instrument; exceeding the…
PYPL formed a Rising Wedge on the 30 Minutes chart. Retest of resistance in sight.
PYPL is heading towards the resistance line of a Rising Wedge. If this movement continues, the price of…
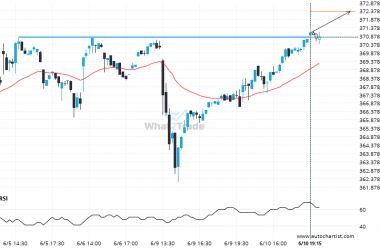
V has broken through a resistance line. It has touched this line numerous times in the last 6 days.
V has broken through a line of 370.8300 and suggests a possible movement to 372.3670 within the next…