
Browsing Category
US Stocks
6606 posts
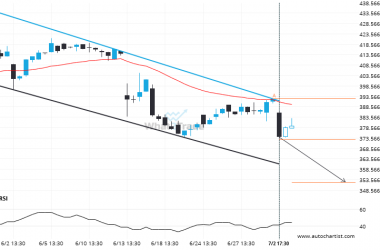
ADBE formed a Channel Down on the 4 hour chart. Retest of support in sight.
The movement of ADBE towards the support line of a Channel Down is yet another test of the…
After trying numerous times in the past, BABA finally breaks 111.2700!
BABA has broken through a line of 111.2700. If this breakout holds true, we could see the price…
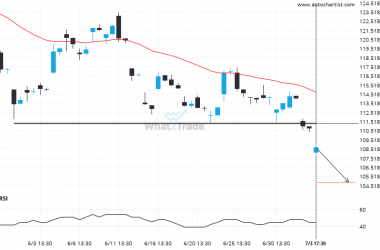
After testing the support line numerous times, NFLX is once again approaching this line. Can we expect a bearish trend to follow?
NFLX is heading towards the support line of a Channel Up and could reach this point within the…
PFE – breach of price line that’s been previously tested numerous times before
PFE has broken through a resistance line. It has touched this line numerous times in the last 63…
After testing support twice in the past, AMZN has finally broken through. Can we expect a bearish trend to follow?
This trade setup on AMZN is formed by a period of consolidation; a period in which the price…
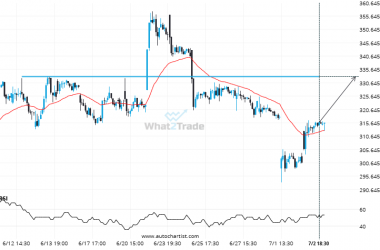
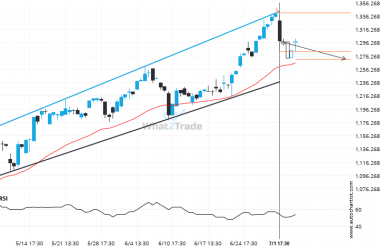
Supports and resistances are primary concepts of technical analysis. TSLA is heading for an important price of 332.9500 – read about what this could mean for the future.
TSLA is moving towards a resistance line. Because we have seen it retrace from this level in the…
A Channel Up has formed, PFE is approaching support. Can we expect a breakout and the start of a new trend or a reversal?
PFE is heading towards the resistance line of a Channel Up. If this movement continues, the price of…
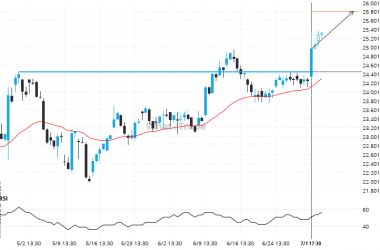
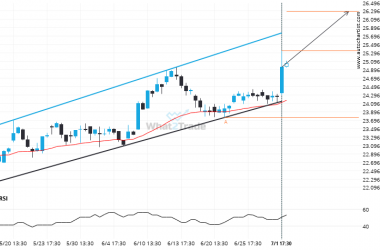
CVX has broken through a resistance line. It has touched this line numerous times in the last 22 days.
A strong resistance level has been breached at 145.1700 on the 1 hour CVX chart. Technical Analysis theory…
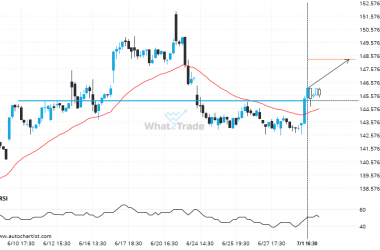
Important support line being approached by INTC. This price has been tested numerous time in the last 49 days
The movement of INTC towards the support line of a Channel Up is yet another test of the…
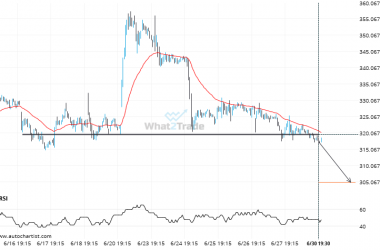
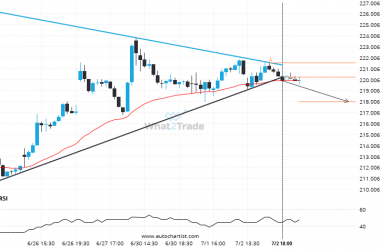
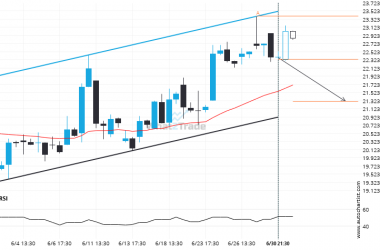
TSLA is currently testing a level of 319.6300. Will the breakout continue or will things reverse?
The price of TSLA in heading in the direction of 304.8880. Despite the recent breakout through 319.6300 it…