
Browsing Category
US Stocks
6604 posts
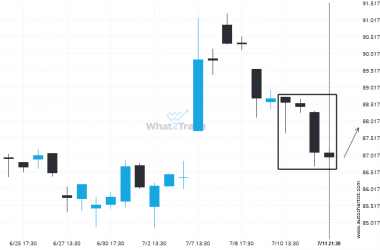
BIDU experienced 4 consecutive 4 hour bearish candles to reach a price of 86.9300
Due to the rate of consecutive bearish candles on BIDU 4 hour chart we could be in for…
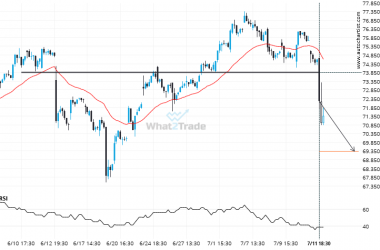
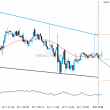
PYPL may be on a start of a new bearish trend after its breakout through this important support level
PYPL has broken through 73.8550 which it has tested numerous times in the past. We have seen it…
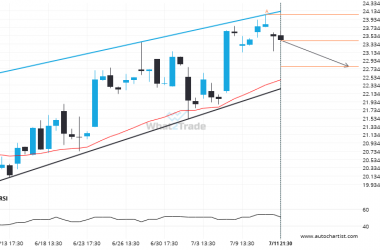
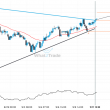
INTC – approaching a support line that has been previously tested at least twice in the past
INTC is trapped in a Channel Up formation, implying that a breakout is Imminent. This is a great…
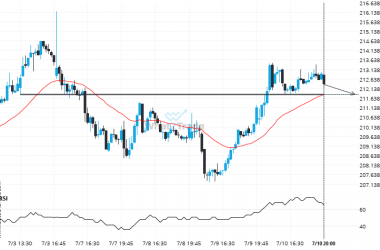
If AAPL touches 211.8250 it may be time to take action.
The movement of AAPL towards 211.8250 price line is yet another test of the line it reached numerous…
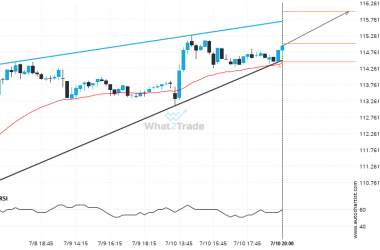
XOM is signaling a possible trend reversal on the intraday charts with price not breaching support.
XOM was identified at around 115.01 having recently rebounded of the support on the 15 Minutes data interval.…
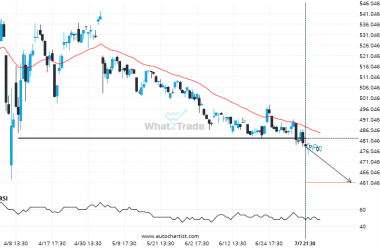
BRK.B may be on a start of a new bearish trend after its breakout through this important support level
BRK.B has broken through a line of 481.9500. If this breakout holds true, we could see the price…
A possible move on PFE as it heads towards support
Emerging Channel Up pattern in its final wave was identified on the PFE 1 hour chart. After a…
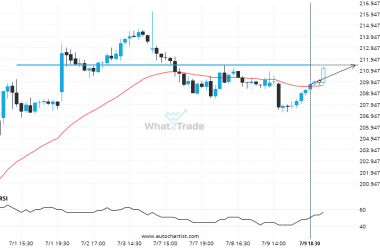
If AAPL touches 211.4400 it may be time to take action.
AAPL is moving towards a line of 211.4400 which it has tested numerous times in the past. We…
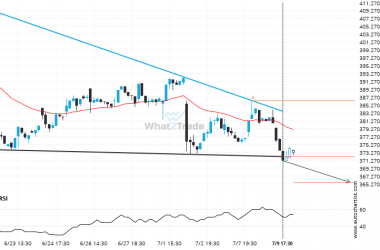
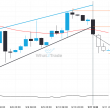
Interesting opportunity on ADBE after breaking 372.25588235294117
The last 28 1 hour candles on ADBE formed a Descending Triangle pattern and broken out through the…
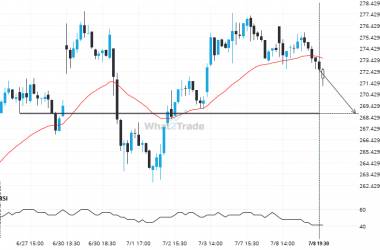
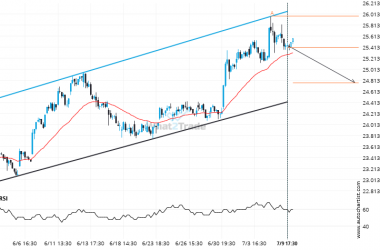
After testing 268.7400 numerous times, AVGO is once again approaching this price point. Can we expect a bearish trend to follow?
AVGO is heading towards a line of 268.7400. If this movement continues, the price of AVGO could test…