


Browsing Category
US Stocks
6657 posts
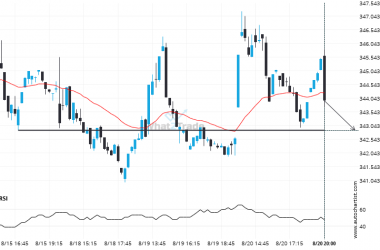
If V touches 342.8850 it may be time to take action.
The price of V in heading back to the support area. It is possible that it will struggle…
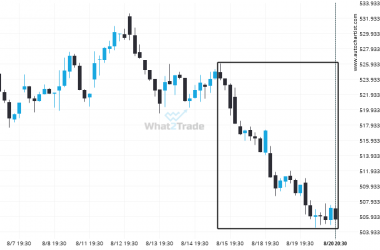
MSFT moves lower to 505.49 in the last 6 days.
MSFT has moved lower by 3.53% from 524.005 to 505.49 in the last 6 days.
NKE is signaling a possible trend reversal on the intraday charts with price not breaching resistance.
Emerging Triangle detected on NKE – the pattern is an emerging one and has not yet broken through…
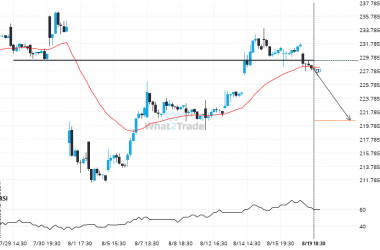
Breach of 229.3200 could mean a start of a bearish trend on AMZN
The breakout of AMZN through the 229.3200 price line is a breach of an important psychological price that…
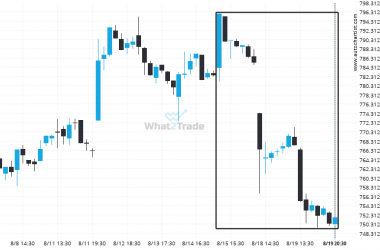
META reached 751.695 after a 5.55% move spanning 5 days.
META dropped sharply for 4 days, marking an unusually large move, exceeding 98% of past price shifts for…
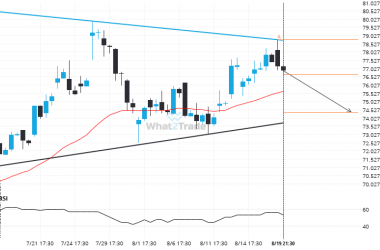
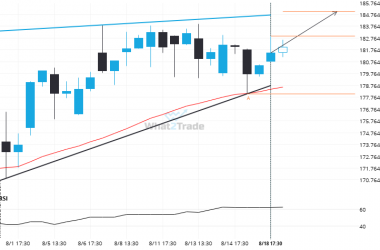
CVX formed a Rising Wedge on the 4 hour chart. Retest of support in sight.
Emerging Rising Wedge pattern in its final wave was identified on the CVX 4 hour chart. After a…
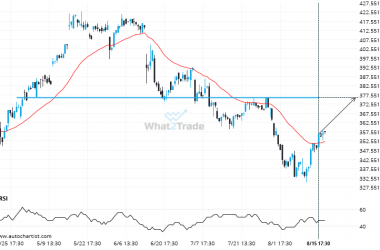
ADBE likely to test 376.1100 in the near future. Where to next?
ADBE is moving towards a resistance line. Because we have seen it retrace from this level in the…
NVDA is signaling a possible trend reversal on the intraday charts with price not breaching support.
An emerging Rising Wedge has been detected on NVDA on the 4 hour chart. There is a possible…

Rare bullish streak on the NKE 4 hour chart.
NKE posted 9 consecutive candles over the last 5 day — an unusually large movement.
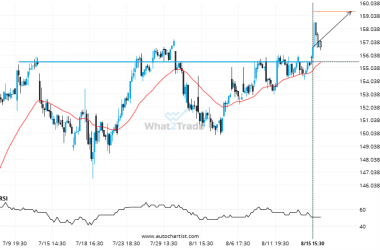
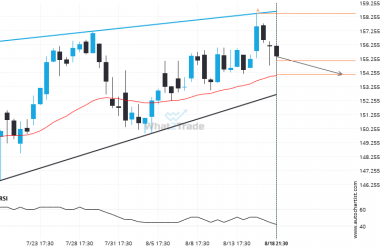
After testing 155.5100 numerous times, CVX has finally broken through. Can we expect a bullish trend to follow?
The price of CVX in heading in the direction of 159.3810. Despite the recent breakout through 155.5100 it…