


Browsing Category
US Stocks
6657 posts

A possible move on NFLX as it heads towards resistance
NFLX is heading towards the resistance line of a Triangle and could reach this point within the next…
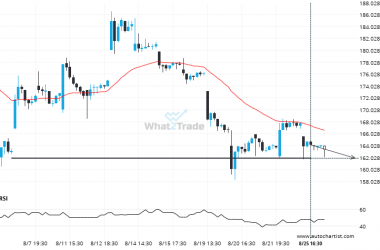
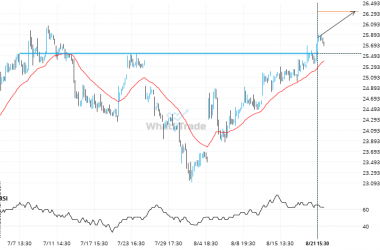
AMD heading towards a price it has tested 4 times in the recent past.
AMD is approaching a support line at 161.8950. If it hits the support line, it may break through…
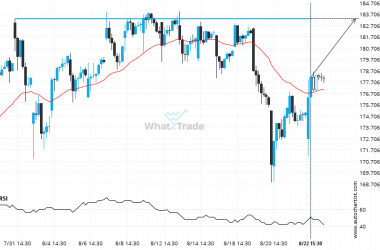
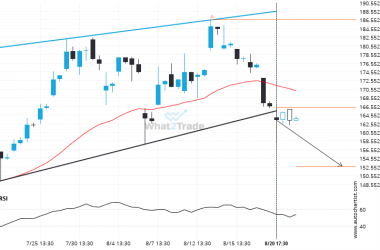
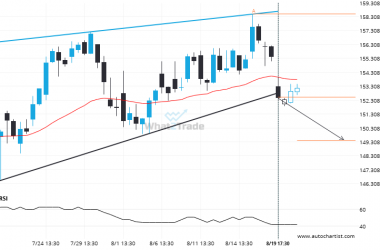
INTC is signaling a possible trend reversal on the intraday charts with price not breaching resistance.
An emerging Channel Down has been detected on INTC on the 30 Minutes chart. There is a possible…
NVDA keeps moving closer towards 183.3100. Will it finally breach this level?
NVDA is en route to a very important line that will be a definite deciding factor of what…
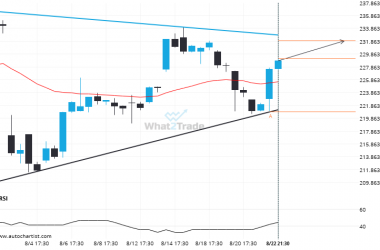
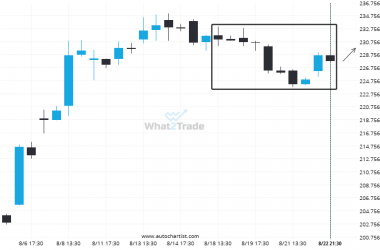
AMZN is approaching a resistance line of a Triangle. It has touched this line numerous times in the last 38 days.
AMZN was identified at around 229.1 having recently rebounded of the support on the 4 hour data interval.…
AAPL recorded 8 consecutive 4 hour bearish candles.
After posting 8 consecutive bearish candles in 5 days, you may start considering where AAPL is heading next,…
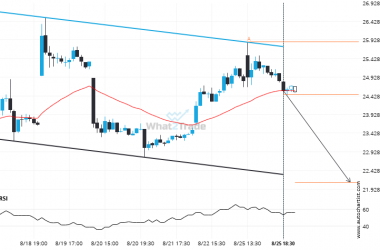
PFE – breach of price line that’s been previously tested numerous times before
The breakout of PFE through the 25.5400 price line is a breach of an important psychological price that…
AMD has broken through support of a Channel Up. It has touched this line at least twice in the last 37 days.
AMD has broken through the support line of a Channel Up technical chart pattern. Because we have seen…
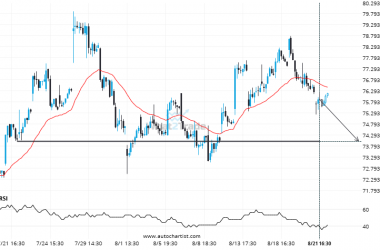
If you’re long NKE you should be aware of the rapidly approaching level of 74.0000
NKE is about to retest a key horizontal support level near 74.0000. It has tested this level 4…
There is a possibility of a big movement on CVX after a breach of the support
The last 40 4 hour candles on CVX formed a Rising Wedge pattern and broken out through the…